AUD/USD crossing above the 200-Day SMA

Monthly uptrend?
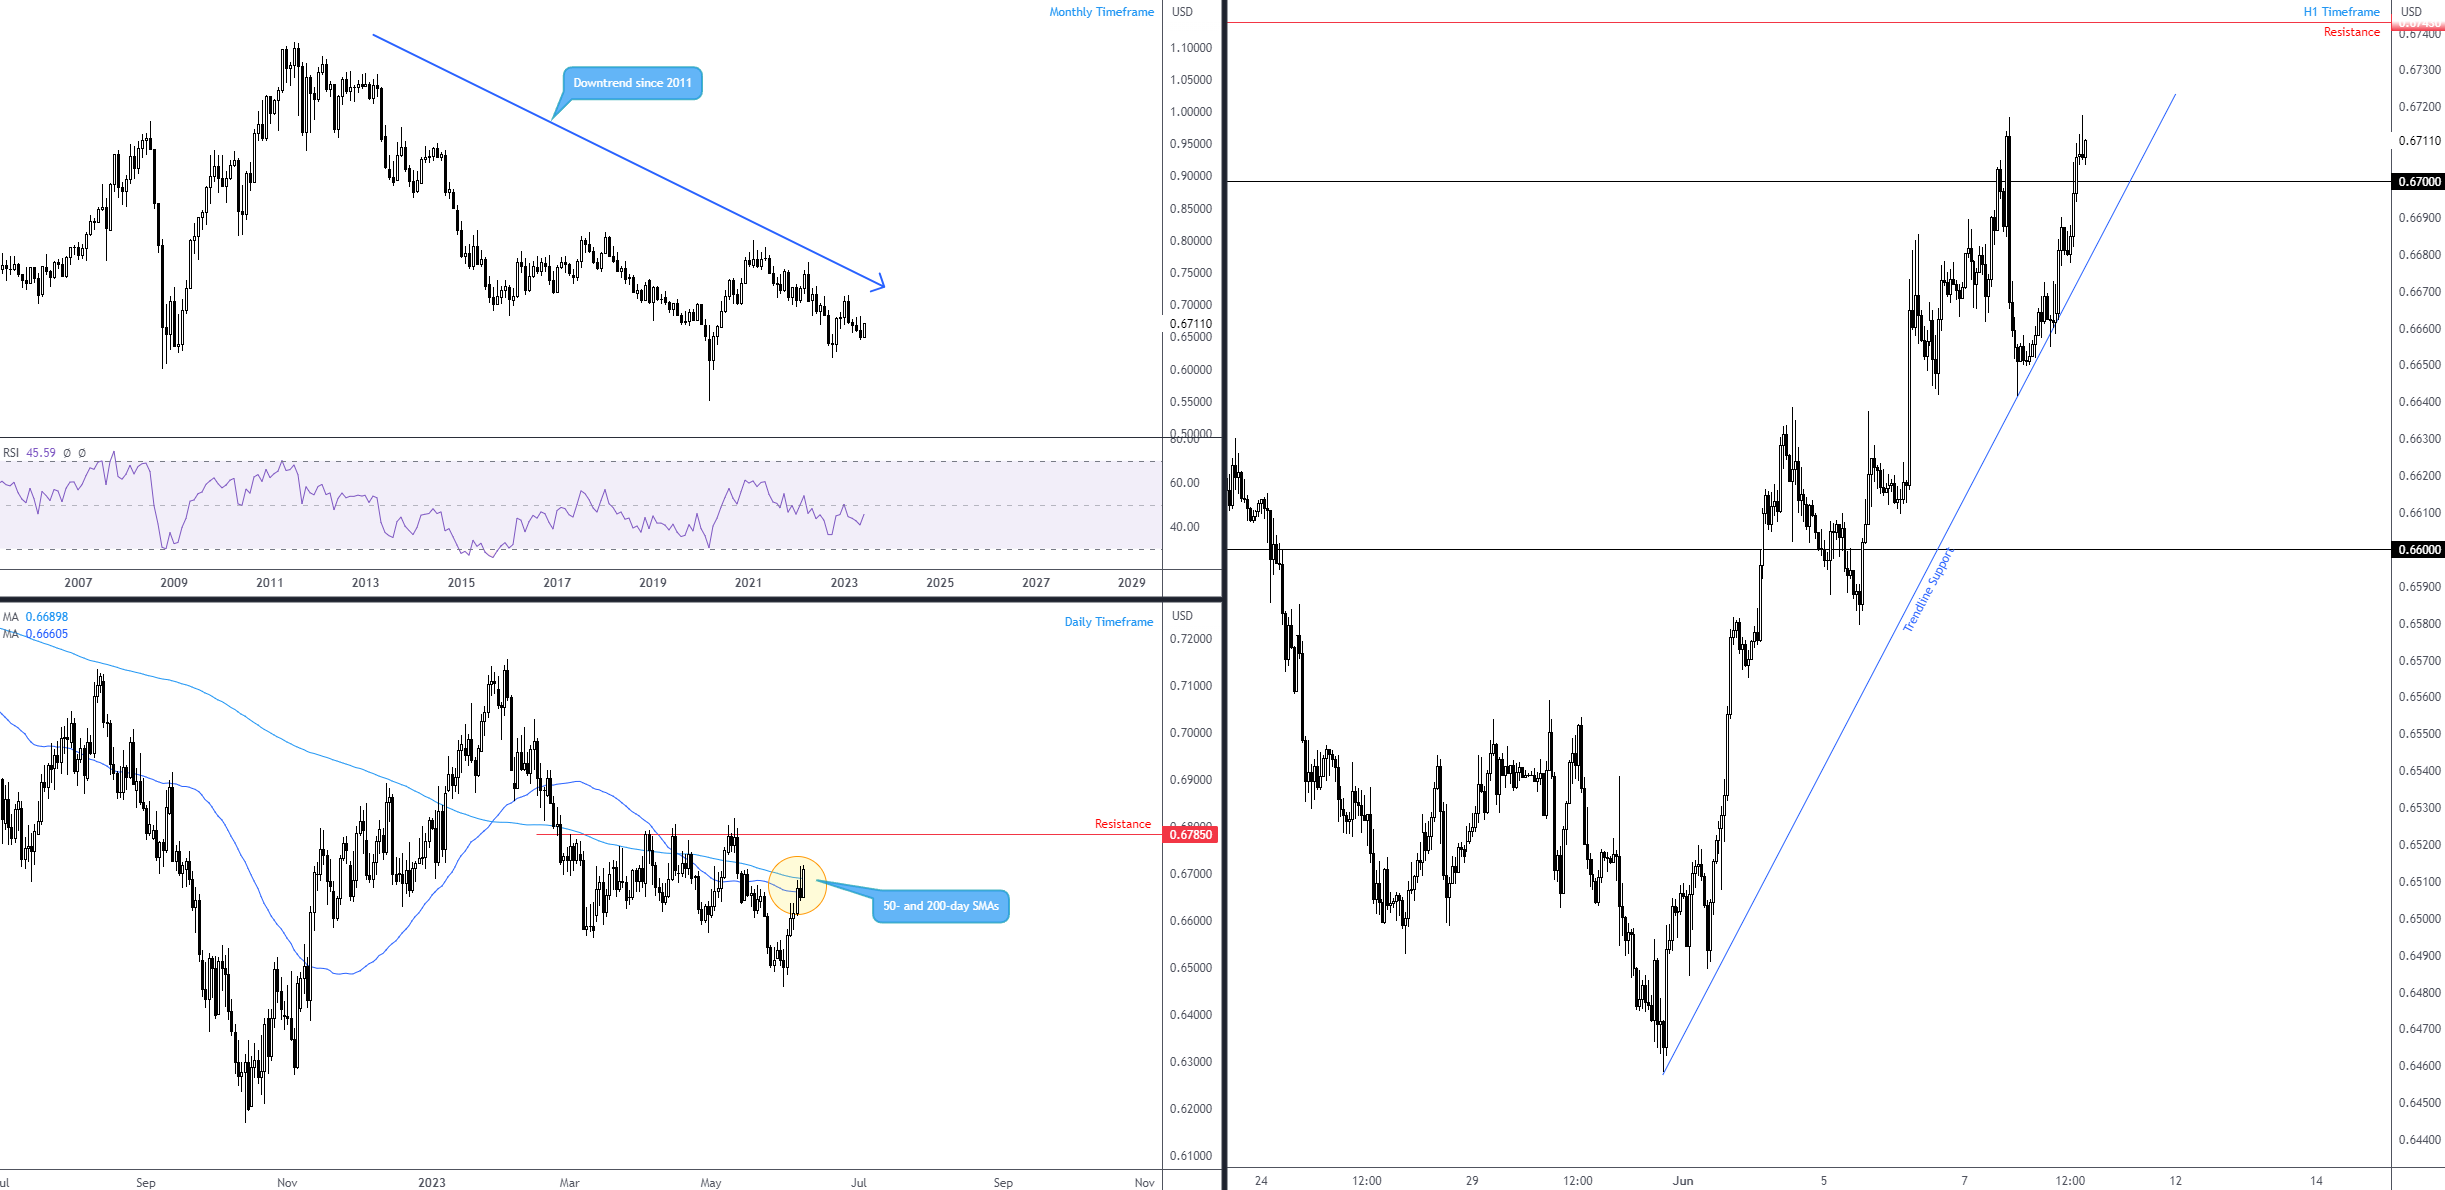
From the monthly timeframe, the AUD/USD has been entrenched in a downtrend since 2011. However, downside momentum has evidently decelerated. The pullback from early 2020 (low of $0.5506) to the high of $0.8007 (February 2021) is deep—deeper than any previous pullback seen in the current downtrend, indicating possible strength on the side of long-term buyers. Maybe. I want to see the (tentative) higher low at $0.6458 hold and price form a higher high before pencilling in a possible uptrend. Until that time, long term, this market remains trending south.
Daily price north of 200-day SMA; H1 action to hold above $0.67?
Out of the daily timeframe, recent trading saw price cross above the 50- and 200-day simple moving averages at $0.6660 and $0.6689, respectively. Among technical analysts, some will consider this an early sign of strength to the upside; this also opens the door to resistance at $0.6785 and echoes a possible bullish breakout scenario. North of $0.6785 would be interesting and throw light on the possibility of a higher high forming on the monthly scale (noted above).
Over on the H1 timeframe, the currency pair recently made its way above the $0.67 figure. If price maintains its position north of the noted level, this could, as suggested by the bigger picture (daily timeframe above moving averages), see the pair approach at least resistance from $0.6743. Additionally, if a $0.67 retest emerges (specifically at the point where a nearby H1 trendline support merges with the round number) and holds the number, this would likely encourage buyers to commit.
Author

Aaron Hill
FP Markets
After completing his Bachelor’s degree in English and Creative Writing in the UK, and subsequently spending a handful of years teaching English as a foreign language teacher around Asia, Aaron was introduced to financial trading,


