AUD/NZD: Buyers are optimistic with an engulfing candle at the double bottom support
AUD/NZD produced a bullish engulfing candle on the daily chart yesterday. The pair had a bounce at the same level earlier. Thus, it is double bottom support. Moreover, the combination of the last three candles produces the morning star, which is a strong bullish reversal candle. Intraday charts seem to be choppy so far. However, the daily chart's price action suggests that they may get bullish soon.
Chart 1 AUD/NZD Daily Chart
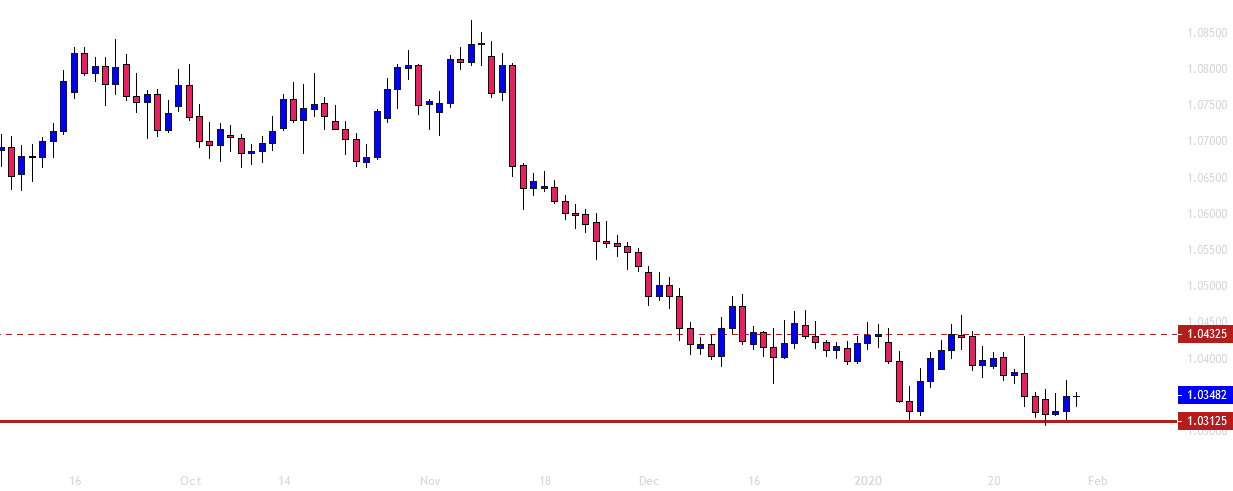
The chart shows that the last candle came out as a bullish engulfing candle produced at the level of 1.03125. The price had a bounce at the same level and made a bullish wave earlier. It found its resistance at the level of 1.04325 and came down up to the same level of support again. Traders must have waited for the price to produce a bullish reversal candle around the level. As far as the Japanese candlestick pattern is concerned, the combination of the last three candles is Morning Star. This is one of the strongest bullish reversal candlestick patterns in the financial market. Let us now have a look at the two major intraday charts.
Chart 2 AUD/NZD H4 Chart
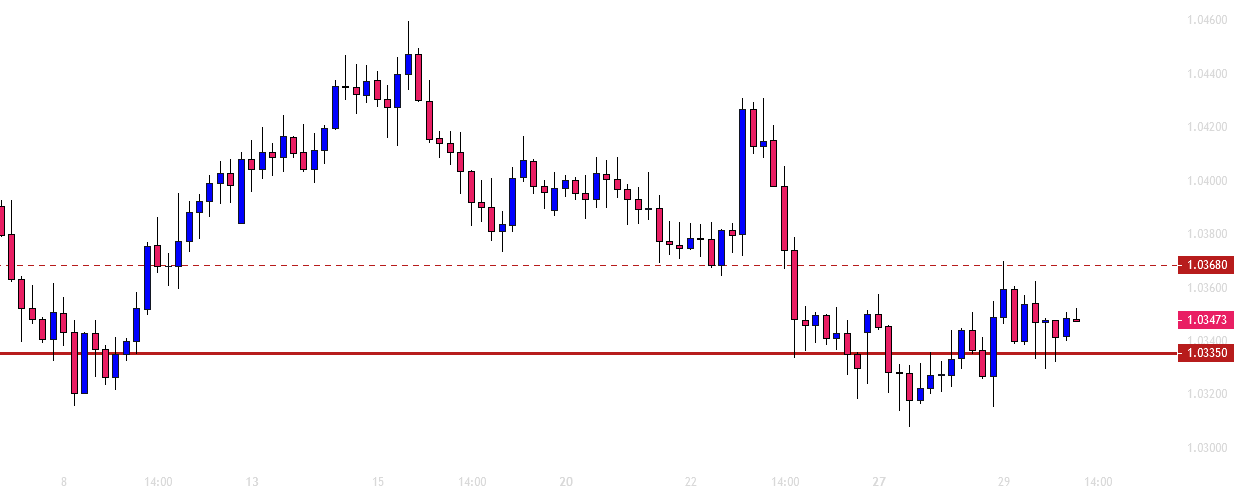
The chart shows that the price has been on strong consolidation. The level of 1.03350 has been working as the level of support, and the level of 1.03680 has been working as the level of resistance. The buyers may go long above the level of 1.03680. The price may find its nest resistance at the level of 1.03850.
Chart 3 AUD/NZD H1 Chart
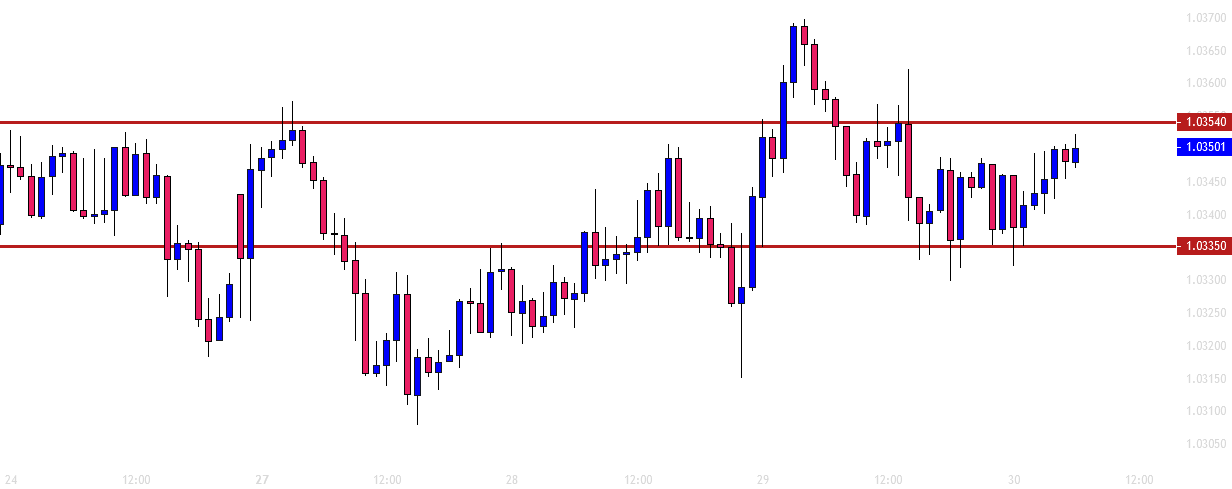
The H1 chart looks very choppy. The chart shows that the price has been heading towards the North after having a bounce at the double top bottom. The way it has been heading towards the North, it may find its resistance soon. The level of 1.03540 may work as a level of resistance since the price reacted at this level several times earlier. The buyers are to wait for the price to make a breakout at the level of 1.03540 to go long on the pair. On the other hand, if the price gets a rejection at the level of resistance, it may remain choppy for a while on the H1 chart.
The H1 and the H4 chart look rather choppy. However, the daily chart looks good for the buyers. If the price produces a daily bullish candle today as well, the pair is going to be dominated by the buyers for some days.
Author

EagleFX Team
EagleFX
EagleFX Team is an international group of market analysts with skills in fundamental and technical analysis, applying several methods to assess the state and likelihood of price movements on Forex, Commodities, Indices, Metals and


