AUD/JPY Elliott Wave technical analysis [Video]
![AUD/JPY Elliott Wave technical analysis [Video]](https://editorial.fxstreet.com/images/Markets/Currencies/Crosses/AUDJPY/forex-australia-and-japanese-currency-pair-with-calculator-4780678_XtraLarge.jpg)
Australian Dollar/Japanese Yen (AUDJPY) – Day Chart Analysis.
AUD/JPY Elliott Wave technical analysis
-
Function: Bearish Trend.
-
Mode: Impulsive.
-
Structure: Orange Wave 1.
-
Position: Navy Blue Wave 3.
-
Next higher degree direction: Orange Wave 2.
Analysis summary
The AUDJPY Elliott Wave analysis on the daily chart indicates a bearish trend for the Australian Dollar against the Japanese Yen. The downward momentum aligns with an impulsive wave structure, with orange wave 1 currently active within navy blue wave 3, highlighting continued bearish sentiment.
-
Navy Blue Wave 2: Appears completed, allowing orange wave 1 of 3 to unfold.
-
Wave Invalidation Level: Set at 102.424. Breaching this level would invalidate the current wave count, signaling a potential shift in trend.
Wave analysis details
-
Orange Wave 1 Activity: Represents the early stages of a new downward phase in the broader navy blue wave 3.
-
Wave 3 Significance: Within Elliott Wave theory, wave 3 typically represents the strongest phase of a trend, amplifying the bearish sentiment.
-
Implication: The structure suggests further declines for AUDJPY as the market progresses through orange wave 1.
The configuration of navy blue wave 3 reinforces a bearish trajectory, implying that the pair has substantial room for continued downside momentum.
Invalidation level and trading implications
The key invalidation level for the bearish structure is 102.424. If the price moves to or above this level, it would invalidate the current Elliott Wave count, suggesting a potential trend reversal. This level acts as a critical benchmark for traders to:
-
Validate the continuation of the bearish trend.
-
Reassess the outlook if the level is breached.
Conclusion
The AUDJPY Elliott Wave analysis on the daily chart supports a bearish outlook. The active progression of orange wave 1 within navy blue wave 3 suggests continued downward movement. However, traders should closely monitor the invalidation level at 102.424, as any breach could signal a trend reversal and challenge the bearish framework.
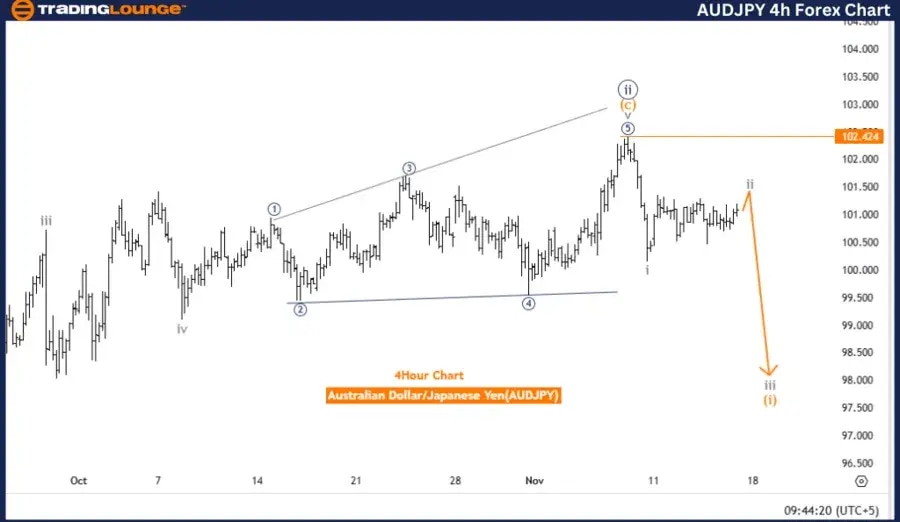
Australian Dollar/Japanese Yen (AUDJPY) – 4-Hour Chart Analysis.
AUD/JPY Elliott Wave technical analysis
-
Function: Bearish Trend.
-
Mode: Impulsive.
-
Structure: Orange Wave 1.
-
Position: Navy Blue Wave 3.
-
Next higher degree direction: Orange Wave 2.
Analysis summary
The AUDJPY Elliott Wave analysis on the 4-hour chart indicates a bearish trend for the Australian Dollar against the Japanese Yen. This bearish outlook is driven by an impulsive wave structure, with orange wave 1 actively progressing within the broader navy blue wave 3.
-
Navy Blue Wave 2: Completed, enabling the development of orange wave 1 of navy blue wave 3.
-
Wave Invalidation Level: Defined at 102.424, marking a crucial threshold for the bearish outlook.
Wave analysis details
-
Orange Wave 1 Activity: Represents the onset of a new bearish trend within the context of the broader navy blue wave 3.
-
Wave 1 Implications: In Elliott Wave theory, wave 1 within an impulsive structure initiates a fresh phase in the trend, confirming bearish momentum.
-
Navy Blue Wave 3: Suggests a strong bearish phase, as wave 3 often signifies a dominant trend-driving force.
-
Bearish Sentiment: Indicates a continued decline for AUDJPY as the market progresses through orange wave 1, with potential for further downside movement in the near term.
Invalidation level and trading implications
The key invalidation level for this wave structure is set at 102.424. A rise in AUDJPY to or beyond this point would invalidate the current Elliott Wave count and could imply:
-
A trend reversal or weakening of the bearish sentiment.
-
A reassessment of the wave structure and trading strategy.
This level serves as a vital checkpoint for traders to confirm the strength and validity of the ongoing bearish trend.
Conclusion
The AUDJPY Elliott Wave analysis on the 4-hour chart maintains a bearish perspective, with orange wave 1 within navy blue wave 3 continuing to drive downward momentum. However, the invalidation level at 102.424 is a critical threshold. Breaching this level would challenge the current bearish structure and indicate a potential shift in trend.
Technical analyst: Malik Awais.
AUD/JPY Elliott Wave technical analysis [Video]
Author

Peter Mathers
TradingLounge
Peter Mathers started actively trading in 1982. He began his career at Hoei and Shoin, a Japanese futures trading company.


