AUD/JPY Elliott Wave technical analysis
Function: Bearish Trend.
Mode: Impulsive.
Structure: Orange wave 1.
Position: Navy blue wave 3.
Next lower degree direction: Orange wave 1 (initiated).
Details: The navy blue wave 2 appears complete, with the orange wave 1 of 3 now active.
Wave cancel level: 109.333.
AUD/JPY day chart analysis
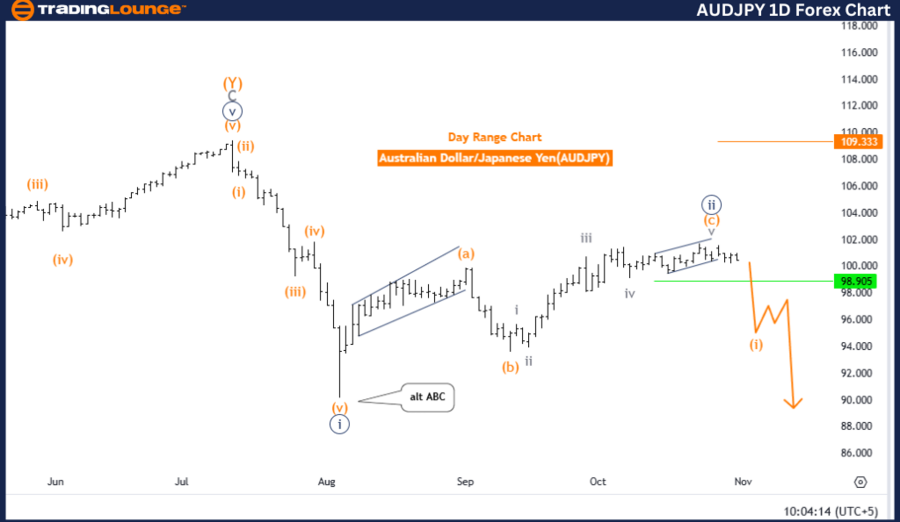
The day chart for AUDJPY, applying Elliott Wave analysis, indicates a bearish trend within an impulsive market structure. Currently, the wave structure is initiating a downward move, identified as orange wave 1 within the larger navy blue wave 3. This points toward a bearish trend onset.
The navy blue wave 2 seems complete, and orange wave 1 of 3 is underway, marking the beginning phase of the larger wave 3 sequence. This wave structure projects a continued decline, as the impulsive nature of orange wave 1 within navy blue wave 3 suggests a further bearish trajectory. The progression of navy blue wave 3 strengthens the bearish outlook, supporting additional downward movement as orange wave 1 advances. This is consistent with typical wave 3 patterns, which are known for significant movements aligning with the primary trend direction.
The wave cancel level is set at 109.333. If AUDJPY rises above this point, the current Elliott Wave interpretation would be deemed invalid, indicating that the downward structure may need reassessment. However, remaining below this level supports the ongoing downward trend, reinforcing the continuation of navy blue wave 3.
Summary
AUDJPY’s daily Elliott Wave analysis presents a strong bearish trend led by orange wave 1 within navy blue wave 3. With navy blue wave 2 considered complete, the chart suggests further declines, provided the price remains below 109.333. This setup aligns with a bearish outlook, pointing to a continuation of the downtrend as navy blue wave 3 unfolds.
AUD/JPY Elliott Wave technical analysis
Function: Bearish Trend.
Mode: Impulsive.
Structure: Orange wave 1.
Position: Navy blue wave 3.
Next lower degree direction: Orange wave 1 (initiated).
Details: The navy blue wave 2 appears to be complete, and orange wave 1 of 3 is now active.
Wave cancel level: 101.574.
AUD/JPY four-hour chart analysis
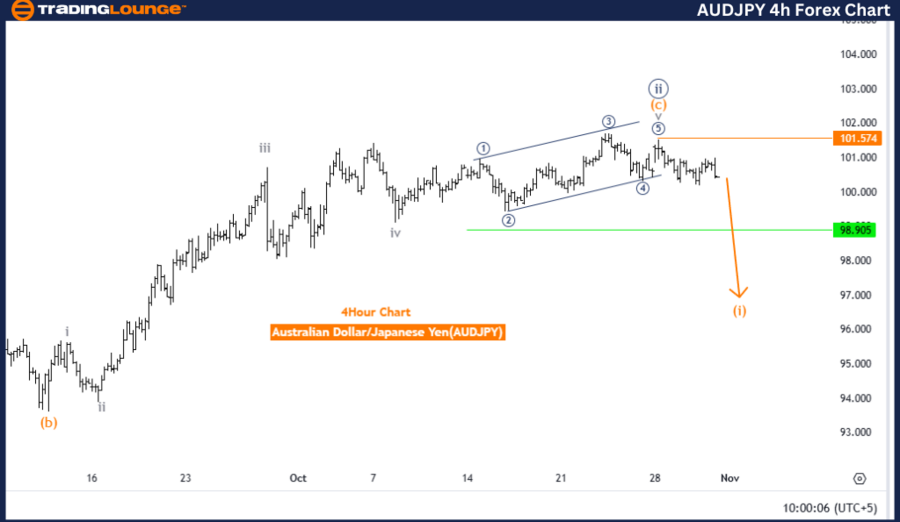
The 4-hour Elliott Wave analysis for AUDJPY indicates a bearish trend within an impulsive market structure. Currently, the pair is developing an impulsive structure, identified as orange wave 1 within a broader navy blue wave 3, suggesting the early stages of a downward movement. This setup follows the likely completion of navy blue wave 2, signaling the end of its retracement phase and the beginning of a new downward sequence in navy blue wave 3.
With orange wave 1 now active, the analysis suggests the bearish trend will likely continue in the near term. This wave represents the initial movement within navy blue wave 3, which could amplify the downward trend if the wave structure remains intact. The next lower degree is expected to maintain the current trend, as the impulsive nature of orange wave 1 within navy blue wave 3 points to a stronger bearish move as navy blue wave 3 unfolds.
The wave cancellation level, set at 101.574, is a critical invalidation point for this wave count. If AUDJPY rises above this level, the current bearish wave interpretation would need to be revised, signaling a potential shift in market sentiment or trend structure. However, staying below this level reinforces the projected bearish outlook in this analysis.
Summary
AUDJPY’s 4-hour Elliott Wave analysis signals a bearish trend with an impulsive structure led by orange wave 1 within navy blue wave 3. The trend appears poised for continued downward movement, provided the price remains below the wave cancel level of 101.574. This setup indicates a potential extension of the bearish trend as navy blue wave 3 progresses in the short term.
AUD/JPY Elliott Wave technical analysis [Video]
As with any investment opportunity there is a risk of making losses on investments that Trading Lounge expresses opinions on.
Historical results are no guarantee of future returns. Some investments are inherently riskier than others. At worst, you could lose your entire investment. TradingLounge™ uses a range of technical analysis tools, software and basic fundamental analysis as well as economic forecasts aimed at minimizing the potential for loss.
The advice we provide through our TradingLounge™ websites and our TradingLounge™ Membership has been prepared without considering your objectives, financial situation or needs. Reliance on such advice, information or data is at your own risk. The decision to trade and the method of trading is for you alone to decide. This information is of a general nature only, so you should, before acting upon any of the information or advice provided by us, consider the appropriateness of the advice considering your own objectives, financial situation or needs. Therefore, you should consult your financial advisor or accountant to determine whether trading in securities and derivatives products is appropriate for you considering your financial circumstances.
Recommended Content
Editors’ Picks

EUR/USD stays near 1.0400 in thin holiday trading
EUR/USD trades with mild losses near 1.0400 on Tuesday. The expectation that the US Federal Reserve will deliver fewer rate cuts in 2025 provides some support for the US Dollar. Trading volumes are likely to remain low heading into the Christmas break.

GBP/USD struggles to find direction, holds steady near 1.2550
GBP/USD consolidates in a range at around 1.2550 on Tuesday after closing in negative territory on Monday. The US Dollar preserves its strength and makes it difficult for the pair to gain traction as trading conditions thin out on Christmas Eve.

Gold holds above $2,600, bulls non-committed on hawkish Fed outlook
Gold trades in a narrow channel above $2,600 on Tuesday, albeit lacking strong follow-through buying. Geopolitical tensions and trade war fears lend support to the safe-haven XAU/USD, while the Fed’s hawkish shift acts as a tailwind for the USD and caps the precious metal.

IRS says crypto staking should be taxed in response to lawsuit
In a filing on Monday, the US International Revenue Service stated that the rewards gotten from staking cryptocurrencies should be taxed, responding to a lawsuit from couple Joshua and Jessica Jarrett.

2025 outlook: What is next for developed economies and currencies?
As the door closes in 2024, and while the year feels like it has passed in the blink of an eye, a lot has happened. If I had to summarise it all in four words, it would be: ‘a year of surprises’.

Best Forex Brokers with Low Spreads
VERIFIED Low spreads are crucial for reducing trading costs. Explore top Forex brokers offering competitive spreads and high leverage. Compare options for EUR/USD, GBP/USD, USD/JPY, and Gold.

