AUD/JPY Elliott Wave technical analysis

AUD/JPY Elliott Wave technical analysis
-
Function: Counter Trend.
-
Mode: Impulsive.
-
Structure: Orange wave C.
-
Position: Navy blue wave 2.
-
Direction next lower degrees: Navy blue wave 3.
Details
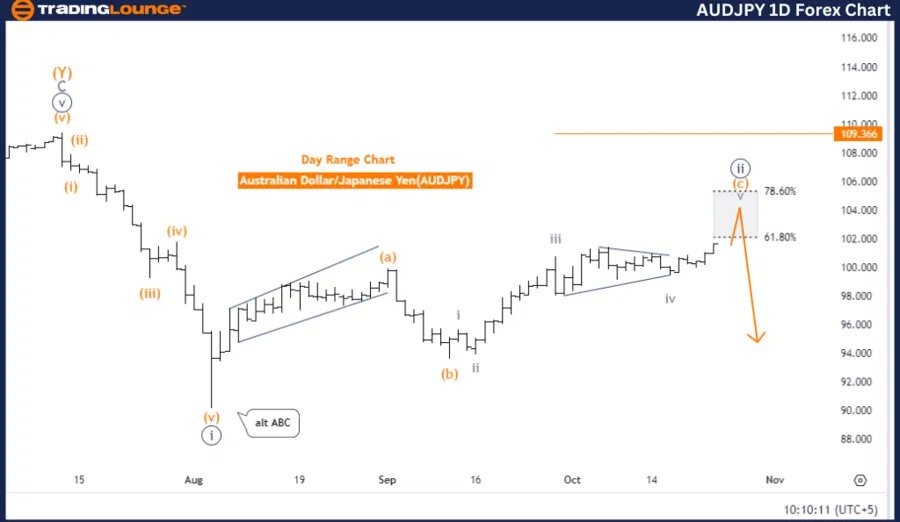
Orange wave B appears completed, with orange wave C of wave 2 now unfolding and approaching its conclusion. The wave cancel invalidation level is set at 109.366.
The AUDJPY Elliott Wave analysis on the daily chart indicates a counter-trend movement, with the mode categorized as impulsive. The current structure involves orange wave C, which forms part of a larger corrective phase known as navy blue wave 2. This implies that the pair is in the final phase of this corrective cycle, poised to resume the next impulsive wave.
Orange wave B has been completed, and orange wave C is currently progressing within navy blue wave 2. Typically, this stage represents the last corrective move before the market transitions into the impulsive navy blue wave 3. As the corrective pattern nears its end, the potential for a trend reversal becomes more likely once navy blue wave 2 concludes.
Once orange wave C is finalized, navy blue wave 3 is expected to commence, indicating the resumption of a broader impulsive trend, moving away from the ongoing corrective structure. Traders should monitor orange wave C’s completion, as it could signal a shift back to a more bullish direction.
The invalidation level for this wave structure is 109.366. If the price falls below this threshold, it will invalidate the current Elliott Wave count, suggesting either an extended corrective phase or a need for wave count adjustment.
In summary, the AUDJPY daily chart shows that orange wave C of navy blue wave 2 is progressing, and the corrective phase is nearing completion. Once wave C concludes, the market is expected to transition into impulsive navy blue wave 3. The key invalidation level to watch is 109.366, indicating a different wave structure if breached.
AUD/JPY day chart
AUD/JPY Elliott Wave technical analysis
-
Function: Counter Trend
-
Mode: Impulsive
-
Structure: Orange wave C
-
Position: Navy blue wave 2
-
Direction next lower degrees: Navy blue wave 3
Details
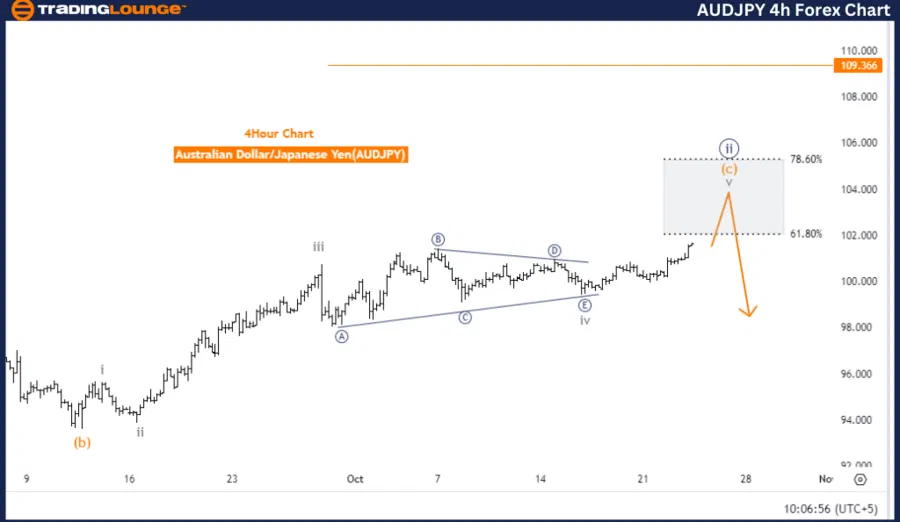
Orange wave B appears completed, and now orange wave C of navy blue wave 2 is actively in play, approaching its end. The wave cancel invalidation level is set at 109.366.
The AUDJPY Elliott Wave analysis on the 4-hour chart highlights a counter-trend movement with an impulsive mode. Currently, the market is within orange wave C, which is part of navy blue wave 2. This implies that the pair is nearing the final stages of a corrective phase before transitioning into the next wave in the broader trend.
Orange wave B has completed, and orange wave C of navy blue wave 2 is now unfolding. This wave typically signifies the last corrective movement before the market resumes its impulsive trend, which is expected to be navy blue wave 3. The corrective phase appears to be nearing its conclusion, indicating a potential shift to a bullish impulsive phase once wave 2 concludes.
The next expected move is the development of navy blue wave 3, signaling a return to the dominant upward trend, assuming the price stays above the invalidation level.
The invalidation level for this wave structure is 109.366. If the price falls below this level, it will invalidate the current Elliott Wave count, potentially extending the corrective wave or requiring a reevaluation of the analysis.
In summary, the AUDJPY 4-hour chart indicates that orange wave C of navy blue wave 2 is in progress, with the corrective phase nearing its end. The next anticipated movement is navy blue wave 3, marking a potential return to the upward trend. The critical invalidation level is 109.366, which would prompt a reassessment if breached.
AUD/JPY four-hour chart
Author

Peter Mathers
TradingLounge
Peter Mathers started actively trading in 1982. He began his career at Hoei and Shoin, a Japanese futures trading company.


