AUD/JPY Elliott Wave technical analysis [Video]
![AUD/JPY Elliott Wave technical analysis [Video]](https://editorial.fxstreet.com/images/Markets/Currencies/Crosses/AUDJPY/forex-australia-and-japanese-currency-pair-with-calculator-4780678_XtraLarge.jpg)
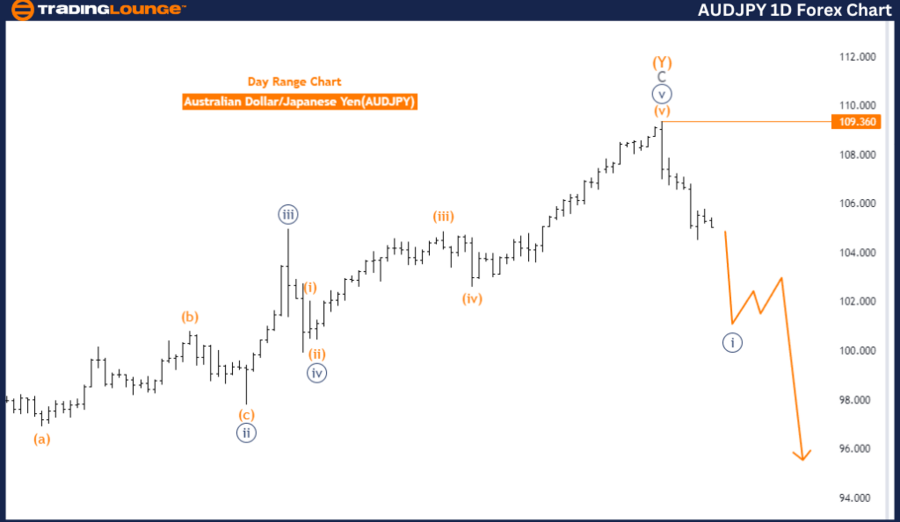
AUDJPY Elliott Wave Analysis - Daily Chart.
AUD/JPY Elliott Wave technical analysis
Function: Trend.
Mode: Impulsive.
Structure: Navy Blue Wave 1.
Position: Gray Wave 1.
Direction next higher degrees: Navy Blue Wave 2.
Details:
-
Current Status: Orange wave Y looks completed. Now, Navy blue wave 1 of 1 as a new trend is in play.
-
Wave Cancel Invalid Level: 109.360.
The AUDJPY Elliott Wave Analysis on the daily chart provides a comprehensive technical outlook on the Australian Dollar versus the Japanese Yen using Elliott Wave Theory.
-
Function: The current market movement is identified as a trend, indicating a directional move in the market.
-
Mode: This trend is classified as impulsive, signifying strong directional waves characteristic of Elliott Wave impulsive sequences.
-
Structure: The specific structure identified is navy blue wave 1, indicating the market is in the first wave of a larger impulsive movement. This wave is crucial as it sets the foundation for the subsequent waves in the impulsive sequence.
-
Position: The current position is gray wave 1, suggesting the market is at the beginning of the initial wave of a smaller degree (gray wave) within the larger navy blue wave 1. This wave marks the start of a new trend and is an essential phase in the overall wave progression.
-
Next Higher Degrees Direction: The analysis points to the development of navy blue wave 2 as the direction for the next higher degrees. Navy blue wave 2 represents a corrective phase typically following the initial impulsive wave, indicating a temporary retracement against the primary trend before resuming the larger impulsive movement.
According to the analysis, orange wave Y appears to have been completed, meaning the preceding corrective phase has ended. Now, navy blue wave 1 of 1 is in play, indicating that the market has entered a new impulsive trend. This wave marks the beginning of a significant directional move in the market.
The wave cancel invalid level is set at 109.360. If the market reaches this level, the current wave count and analysis would be invalidated. This level serves as a critical point for reevaluating the wave structure.
Summary: The AUDJPY daily chart analysis shows the market is in an impulsive trend, currently in navy blue wave 1, with the position at gray wave 1. The next expected phase is navy blue wave 2, following the completion of the current impulsive wave. The analysis suggests the market has completed orange wave Y and is now progressing through navy blue wave 1 of 1 as a new trend. The wave cancel invalid level is set at 109.360, providing a crucial point for reassessment if reached.
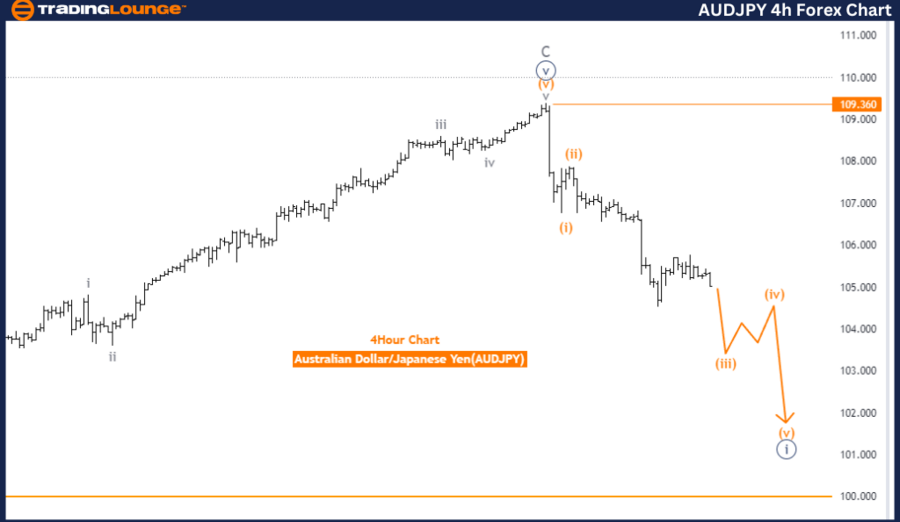
AUDJPY Elliott Wave Analysis - 4 Hour Chart.
AUDJPY Elliott Wave technical analysis
Function: Trend.
Mode: Impulsive.
Structure: Orange Wave 3.
Position: Navy Blue Wave 1.
Direction next higher degrees: Orange Wave 4.
Details:
-
Current Status: Orange wave 2 appears completed. Now, orange wave 3 is in play.
-
Wave Cancel Invalid Level: 109.360.
The AUDJPY Elliott Wave Analysis on the 4-hour chart offers an in-depth technical perspective on the Australian Dollar versus the Japanese Yen using Elliott Wave Theory.
-
Function: The current market movement is identified as a trend, indicating a consistent directional move.
-
Mode: This trend is classified as impulsive, meaning the market is experiencing strong, directional waves typical of an Elliott Wave impulse sequence, which generally consists of five waves.
-
Structure: The specific structure identified is orange wave 3. This suggests that the market is in the third wave of an impulsive phase, often the strongest and most significant wave in the Elliott Wave sequence.
-
Position: The position within this structure is at navy blue wave 1, indicating that the market has just started the first wave of a larger degree (navy blue wave) within the orange wave 3. This initial wave sets the stage for subsequent waves within the larger impulsive movement.
-
Next Higher Degrees Direction: The analysis points to the development of orange wave 4 after the completion of orange wave 3. Orange wave 4 represents a corrective phase, typically a temporary retracement against the primary trend before resuming the larger impulsive movement.
According to the analysis, orange wave 2 appears to have been completed, meaning the corrective phase that preceded the current impulsive move has ended. Now, orange wave 3 is in play, indicating that the market is currently in the middle of this strong, directional wave.
The wave cancel invalid level is set at 109.360. If the market reaches this level, the current wave count and analysis would be invalidated. This level serves as a critical point for reevaluating the wave structure.
Summary: The AUDJPY 4-hour chart analysis shows that the market is in an impulsive trend, currently in orange wave 3, with the position at navy blue wave 1. The next expected phase is orange wave 4, following the completion of orange wave 3. The analysis suggests the market has completed orange wave 2 and is now progressing through the significant orange wave 3. The wave cancel invalid level is set at 109.360, providing a critical point for reassessment if reached.
Technical analyst: Malik Awais
AUDJPY Elliott Wave technical analysis [Video]
Author

Peter Mathers
TradingLounge
Peter Mathers started actively trading in 1982. He began his career at Hoei and Shoin, a Japanese futures trading company.


