AUD/JPY Elliott Wave technical analysis [Video]
![AUD/JPY Elliott Wave technical analysis [Video]](https://editorial.fxstreet.com/images/Markets/Currencies/Crosses/AUDJPY/forex-australia-and-japanese-currency-pair-with-calculator-4780678_XtraLarge.jpg)
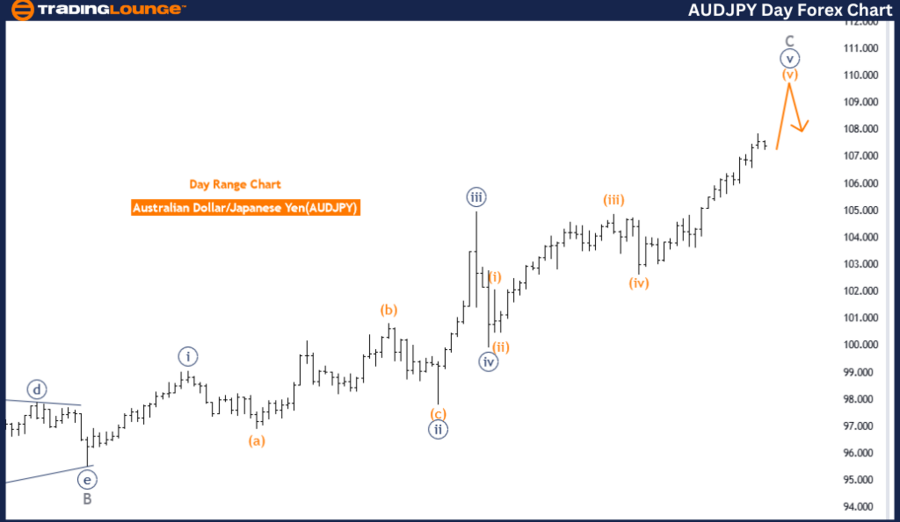
Australian Dollar / Japanese Yen (AUDJPY) Day Chart Analysis.
AUD/JPY Elliott Wave technical analysis
Function: Counter Trend.
Mode: Impulsive.
Structure: Orange Wave 5.
Position: Navy Blue Wave 5 of C.
Direction next lower degrees: Orange Wave 1 of New Bearish Trend.
Details: The analysis identifies orange wave 4 of 5 as completed, with orange wave 5 of 5 currently in play and nearing its end.
The Elliott Wave analysis for the Australian Dollar / Japanese Yen (AUDJPY) daily chart indicates a counter-trend function, suggesting the market is moving in a direction opposite to the primary trend, implying a phase of correction or temporary reversal.
The current market mode is impulsive, meaning the waves move strongly in the direction of the trend, comprising five waves. This indicates a strong push opposite to the main trend.
The identified structure is orange wave 5, which in Elliott Wave Theory, represents the final wave of a five-wave sequence. This wave typically marks the last push in the counter-trend direction before a reversal or significant correction begins.
The position within this structure is navy blue wave 5 of C, indicating the market is in the fifth wave of a larger corrective wave C. Wave C typically concludes an ABC corrective pattern, which follows a five-three-five structure.
The direction for the next lower degrees is identified as orange wave 1 of a new bearish trend. This suggests that after completing the current orange wave 5, the market will start a new downward trend, beginning with orange wave 1.
According to the analysis, orange wave 4 of 5 appears completed. This implies that the fourth wave in the sequence has finished, and the market is now in orange wave 5 of 5. Orange wave 5 of 5 is currently in play and is expected to end soon, signaling the conclusion of the counter-trend movement.
Summary: The AUDJPY daily chart analysis shows the market in a counter-trend function with an impulsive mode. The current structure is orange wave 5, positioned as navy blue wave 5 of C. The market is anticipated to move into orange wave 1 of a new bearish trend following the completion of orange wave 5 of 5. The analysis indicates that orange wave 4 of 5 is complete, and orange wave 5 of 5 is nearing its end.
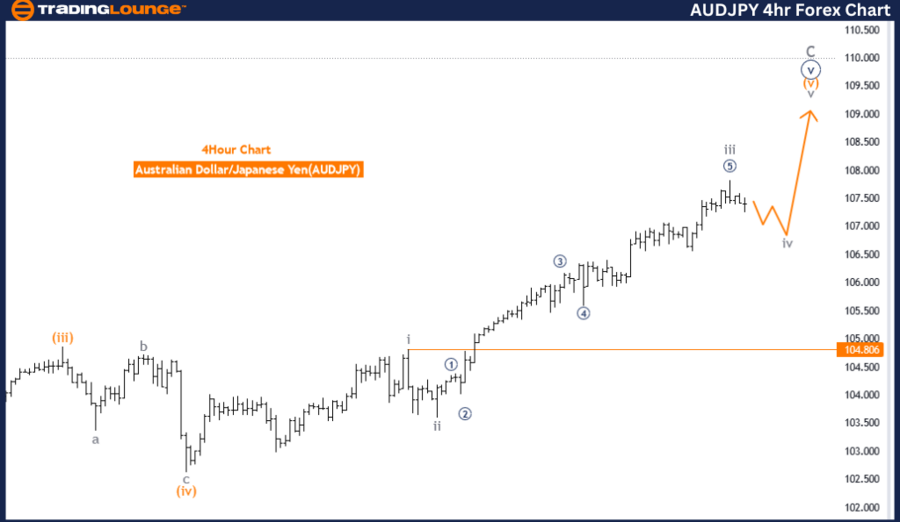
AUD/JPY four-hour chart analysis
Function: Trend.
Mode: Corrective.
Structure: Gray Wave 4.
Position: Orange Wave 5.
Direction next higher degrees: Gray Wave 5.
Details: Gray wave 3 of 5 appears completed. Gray wave 4 of 5 is in play. Wave cancel invalid level: 104.806.
The Elliott Wave analysis for the Australian Dollar / Japanese Yen (AUDJPY) on the 4-hour chart identifies the market's function as trending, meaning price movements follow a discernible directional pattern.
The current market mode is corrective, indicating a phase of consolidation or correction following a previous impulsive move. Corrective waves typically move against the main trend and are often more complex.
The identified structure is gray wave 4, which, according to Elliott Wave Theory, represents the fourth corrective wave of a larger five-wave sequence. This wave usually moves against the established trend, indicating a period of consolidation or retracement.
The position within this structure is orange wave 5, suggesting the market is preparing to enter or is already in the final wave of the larger sequence. Orange wave 5 typically follows the completion of gray wave 4, marking a final push in the main trend's direction before a larger correction or reversal.
The direction for the next higher degrees is identified as gray wave 5, indicating that once gray wave 4 completes, the market will move into gray wave 5, likely an impulsive move in the primary trend's direction.
According to the analysis, gray wave 3 of 5 appears completed, implying the third wave in the sequence has finished, and the market is now in gray wave 4 of 5. Gray wave 4 is a corrective phase, suggesting potential consolidation or retracement before the final wave (gray wave 5) begins.
The wave cancel invalid level is set at 104.806. This level is crucial for validating the current wave structure. If the market moves below this level, the current wave count would be invalidated, necessitating a reevaluation of the wave analysis.
AUD/JPY Elliott Wave technical analysis [Video]
Author

Peter Mathers
TradingLounge
Peter Mathers started actively trading in 1982. He began his career at Hoei and Shoin, a Japanese futures trading company.


