USD: Sept '24 is Down at 102.280.

Energies: Sept '24 Crude is Down at 78.04.

Financials: The Sept '24 30 Year T-Bond is Up 9 ticks and trading at 124.09

Indices: The Sept '24 S&P 500 emini ES contract is 4 ticks Lower and trading at 5854.00.

Gold: The Dec'24 Gold contract is trading Up at 2512.00

Initial conclusion

This is not a correlated market. The USD is Down and Crude is Down which is not normal, but the 30 Year T-Bond is trading Up. The Financials should always correlate with the US dollar such that if the dollar is Higher, then the bonds should follow and vice-versa. The S&P is Lower and Crude is trading Lower which is not correlated. Gold is trading Higher which is correlated with the US dollar trading Down. I tend to believe that Gold has an inverse relationship with the US Dollar as when the US Dollar is down, Gold tends to rise in value and vice-versa. Think of it as a seesaw, when one is up the other should be down. I point this out to you to make you aware that when we don't have a correlated market, it means something is wrong. As traders you need to be aware of this and proceed with your eyes wide open. Asia traded Mixed.  All of Europe is trading Higher.

Possible challenges to traders

  • Core CPI m/m is out at 8:30 AM EST. This is Major.

  • CPI m/m is out at 8:30 AM EST. This is Major.

  • CPI y/y is out at 8:30 AM EST. This is Major.

  • Crude Oil Inventories is out at 10:30 AM EST.  This is Major.

Traders, please note that we've changed the Bond instrument from the 10 year (ZN) to the 2 year (ZT).  They work exactly the same.  

We've elected to switch gears a bit and show correlation between the 10-year Treasury notes (ZN) and the S&P futures contract.  The YM contract is the Dow Jones Industrial Average, and the purpose is to show reverse correlation between the two instruments.  Remember it's likened to a seesaw, when up goes up the other should go down and vice versa.

Yesterday the ZT migrated Higher at around 8:30 AM EST. If you look at the charts below the ZT gave a signal at around 8:30 AM with no real economic news is sight and started its Downward slide. Look at the charts below and you'll see a pattern for both assets. The Dow moved Lower at 8:30 AM and the ZT moved Higher at around the same time. These charts represent the newest version of BarCharts, and I've changed the timeframe to a 15-minute chart to display better. This represented a Long opportunity on the 2-year note, as a trader you could have netted about 40 plus ticks per contract on this trade. Each tick is worth $7.625. Please note: the front month for ZT is Sept and the Dow is now Sept '24. I've changed the format to filled Candlesticks (not hollow) such that it may be more apparent and visible.

Charts courtesy of Barcharts

Chart

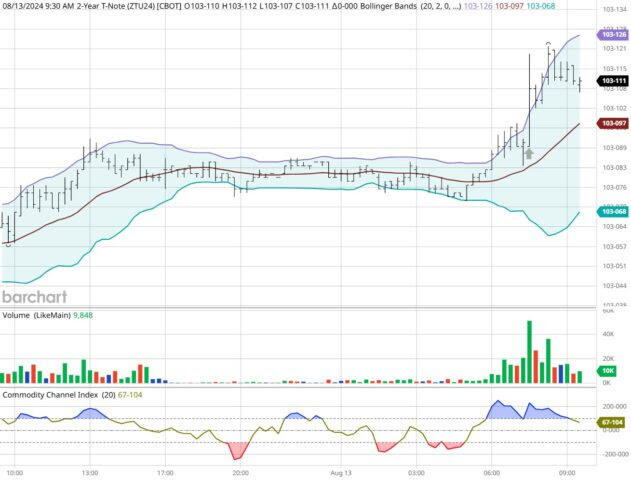
ZT -Sept 2024 - 08/13.24

Chart

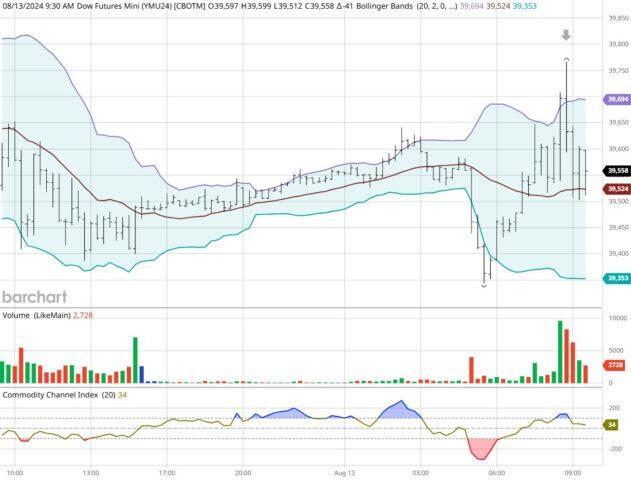
Dow - Sept 2024- 08/13/24

Bias

Yesterday we gave the markets an Upside bias and the markets didn't disappoint. The Dow gained 409 points, and the other indices gained ground as well. Today we aren't dealing with a correlated market and our bias is Neutral or Mixed.

Could this change? Of Course. Remember anything can happen in a volatile market. 

Commentary

Yesterday the concern seemed to be over the PPi numbers out at 8:30 AM EST. This turned out to be a non-event as the PPI numbers were tame compared to past reports.  The expectation was 0.2% and it turned out to be a flat zero, which will serve to take away the notion of higher prices at the producer or manufacturer level. Today we have the CPI numbers which will hit the consumer directly, but we hope that yesterday's report will have some bearing on the Consumer Price Index. But as in all things only time will tell...

Trading performance displayed herein is hypothetical. The following Commodity Futures Trading Commission (CFTC) disclaimer should be noted.

Hypothetical performance results have many inherent limitations, some of which are described below. No representation is being made that any account will or is likely to achieve profits or losses similar to those shown.

In fact, there are frequently sharp differences between hypothetical performance results and the actual results subsequently achieved by any particular trading program. One of the limitations of hypothetical performance trading results is that they are generally prepared with the benefit of hindsight.

In addition, hypothetical trading does not involve financial risk, and no hypothetical trading record can completely account for the impact of financial risk in actual trading. For example, the ability to withstand losses or to adhere to a particular trading program in spite of trading losses are material points which can also adversely affect actual trading results.

There are numerous other factors related to the markets in general or to the implementation of any specific trading program which cannot be fully accounted for in the preparation of hypothetical performance results and all of which can adversely affect actual trading results.

Trading in the commodities markets involves substantial risk and YOU CAN LOSE A LOT OF MONEY, and thus is not appropriate for everyone. You should carefully consider your financial condition before trading in these markets, and only risk capital should be used.

In addition, these markets are often liquid, making it difficult to execute orders at desired prices. Also, during periods of extreme volatility, trading in these markets may be halted due to so-called “circuit breakers” put in place by the CME to alleviate such volatility. In the event of a trading halt, it may be difficult or impossible to exit a losing position.

Recommended Content


Recommended Content

Editors’ Picks

EUR/USD clings to strong daily gains above 1.1000 after US CPI

EUR/USD clings to strong daily gains above 1.1000 after US CPI

EUR/USD trades at its highest level since early January above 1.1000 in the American session on Wednesday. The US Dollar struggles to find demand after July inflation data came in line with market expectations, allowing the pair to push higher.

EUR/USD News

GBP/USD holds near 1.2850 following UK and US inflation reports

GBP/USD holds near 1.2850 following UK and US inflation reports

GBP/USD struggles to gain traction and trades marginally lower on the day at around 1.2850. Earlier in the day, softer-than-expected inflation data from the UK weighed on Pound Sterling but July CPI figures from the US limited the USD's gains.

GBP/USD News

Gold drops below $2,460 as markets assess US inflation figures

Gold drops below $2,460 as markets assess US inflation figures

Gold remains under modest bearish pressure and trades below $2,460 in the second half of the day on Wednesday. Although the US Dollar stays on the back foot after the July CPI data, XAU/USD finds it difficult to push higher as sentiment turns mixed.

Gold News

Maker price poised for rally following Grayscale's launch of MakerDAO Trust

Maker price poised for rally following Grayscale's launch of MakerDAO Trust

Maker (MKR) saw a 6.3% price rally on Tuesday and remains up 0.3% at $2,147 on Wednesday. A negative spike in MKR's Exchange Flow Balance and rising open interest signal a bullish trend. 

Read more

Federal Reserve scenarios: More twists and turns to come

Federal Reserve scenarios: More twists and turns to come

Having priced a high chance of an inter-meeting Fed rate cut last week, interest rate expectations have moderated in the wake of better data and calming words from Fed officials.

Read more

Majors

Cryptocurrencies

Signatures