The markets didn't quite like the news that prices for autos will increase

USD: Jun '25 is Up at 103.780.
Energies: May '25 Crude is Up at 69.74.
Financials: The Jun '25 30 Year T-Bond is Higher by 23 ticks and trading at 117.26.
Indices: The Jun '25 S&P 500 emini ES contract is 204 ticks Lower and trading at 5574.00
Gold: The Jun'25 Gold contract is trading Up at 3155.50
Initial conclusion
This is not a correlated market. The USD is Up and Crude is Up which is not normal, and the 30 Year T-Bond is trading Higher. The Financials should always correlate with the US dollar such that if the dollar is Higher, then the bonds should follow and vice-versa. The S&P is Lower and Crude is trading Higher which is correlated. Gold is trading Higher which is not correlated with the US dollar trading Up. I tend to believe that Gold has an inverse relationship with the US Dollar as when the US Dollar is down, Gold tends to rise in value and vice-versa. Think of it as a seesaw, when one is up the other should be down. I point this out to you to make you aware that when we don't have a correlated market, it means something is wrong. As traders you need to be aware of this and proceed with your eyes wide open. All of Asia traded Lower. All of Europe is trading Lower as well.
Possible challenges to traders
-
Chicago PMI is out at 9:45 AM EST. This is Major.
-
Lack of Major economic news.
Traders, please note that we've changed the Bond instrument from the 10 Year (ZN) to the 2 Year (ZT). They work exactly the same.
We've elected to switch gears a bit and show correlation between the 2-year Treasury notes (ZT) and the S&P futures contract. The YM contract is the Dow Jones Industrial Average, and the purpose is to show reverse correlation between the two instruments. Remember it's likened to a seesaw, when up goes up the other should go down and vice versa.
On Friday the ZT veered Higher at around 8:30 AM EST with Personal Income and Spending numbers pending at that time. The Dow moved Lower at the same time. Look at the charts below and you'll see a pattern for both assets. The Dow moved Lower at 8:30 AM EST and the ZT moved Higher at around the same time. These charts represent the newest version of Bar Charts, and I've changed the timeframe to a 15-minute chart to display better. This represented a Long opportunity on the 2-year note, as a trader you could have netted about a dozen plus ticks per contract on this trade. Each tick is worth $6.25. Please note: the front month for ZT is now Jun '25 and the Dow is Jun '25 as well. I've changed the format to filled Candlesticks (not hollow) such that it may be more apparent and visible.
Charts courtesy of BarCharts
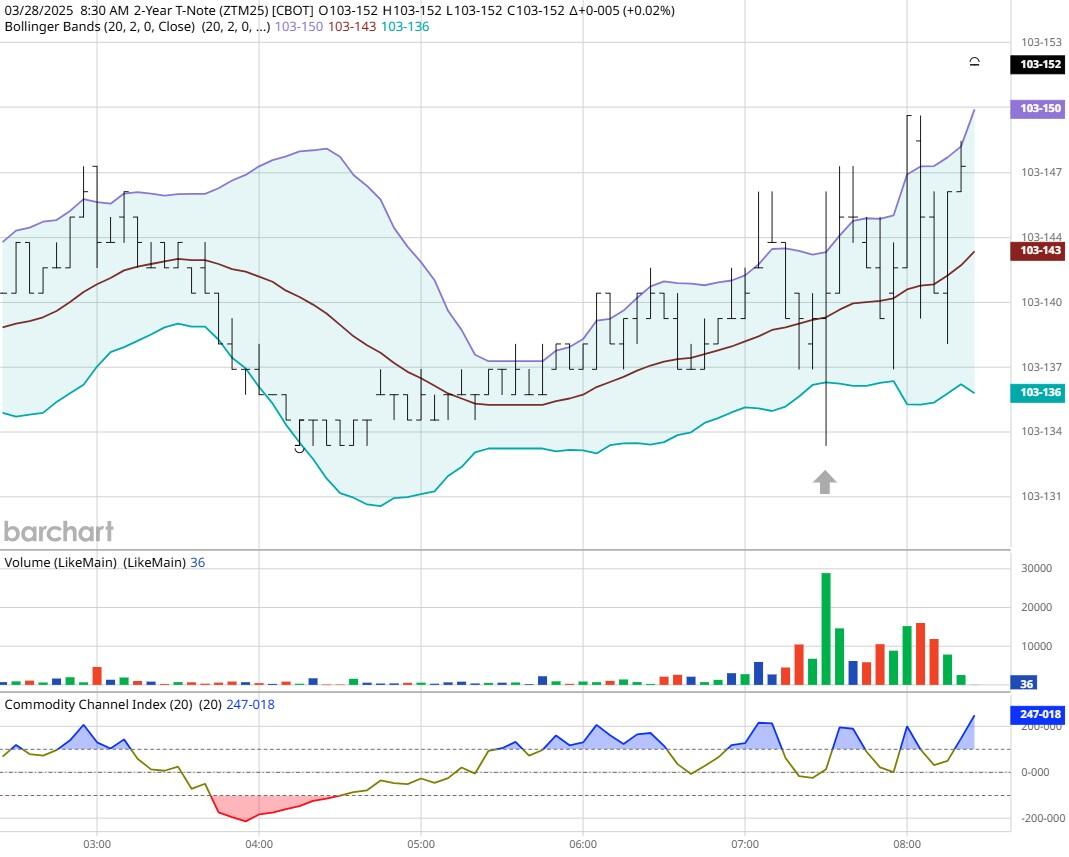
ZT -Jun 2025 - 3/28/25
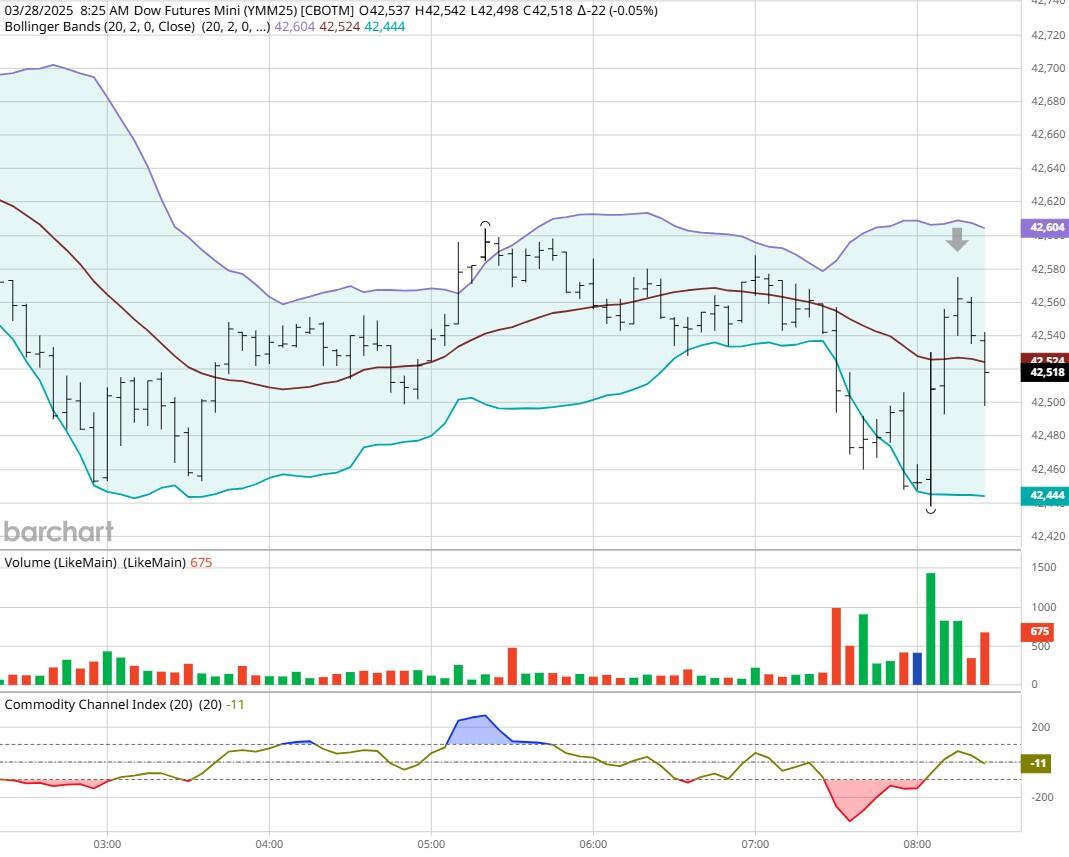
Dow - Mar 2025- 3/28/25
Bias
On Friday we gave the markets a Downside bias as both the USD and Bonds were trading Higher Friday morning and that usually represents a Down Day. The markets didn't disappoint as the Dow dropped 155 points and the other indices lost ground as well. Today we aren't dealing with a correlated market and will maintain a Downside bias.
Could this change? Of Course. Remember anything can happen in a volatile market.
Commentary
As stated previously, the markets didn't quite like the news that prices for autos will increase. Not only will this affect an auto assembled in the USA but also any vehicle that has car parts not manufactured in the USA. There is no such thing as an auto manufactured in the USA with all domestic parts and raw materials. That hasn't happened since the 1970's, so all autos will increase in price. Want to learn Market Correlation and determine market direction hours before the Opening Bell?
Author

Nick Mastrandrea
Market Tea Leaves


