Another jobs Friday

USD: Sept '24 is Down at 104.675.
Energies: Aug '24 Crude is Down at 83.83.
Financials: The Sept '24 30 Year T-Bond is Down 1 tick and trading at 117.31.
Indices: The Sept '24 S&P 500 emini ES contract is 3 ticks Higher and trading at 5591.00.
Gold: The Aug'24 Gold contract is trading Up at 2372.70.
Initial conclusion
This is not a correlated market. The USD is Down and Crude is Down which is not normal, and the 30 Year T-Bond is trading Down. The Financials should always correlate with the US dollar such that if the dollar is Higher, then the bonds should follow and vice-versa. The S&P is Higher and Crude is trading Lower which is correlated. Gold is trading Higher which is correlated with the US dollar trading Down. I tend to believe that Gold has an inverse relationship with the US Dollar as when the US Dollar is down, Gold tends to rise in value and vice-versa. Think of it as a seesaw, when one is up the other should be down. I point this out to you to make you aware that when we don't have a correlated market, it means something is wrong. As traders you need to be aware of this and proceed with your eyes wide open. All of Asia is trading Lower. Currently all of Europe is trading Higher except the Spanish Ibex exchange.
Possible challenges to traders
-
FOMC Member Williams Speaks at 5:40 AM EST. This is Major.
-
Average Hourly Earnings m/m is out at 8:30 AM EST. This is Major.
-
Non-Farm Employment Change is out at 8:30 AM EST. This is Major.
-
Unemployment Rate is out at 8:30 AM EST. This is Major.
-
Fed Monetary Policy Report is out at 11 AM EST. This is Major.
Traders, please note that we've changed the Bond instrument from the 10 year (ZN) to the 2 year (ZT). They work exactly the same.
We've elected to switch gears a bit and show correlation between the 10-year Treasury notes (ZN) and the S&P futures contract. The YM contract is the Dow Jones Industrial Average, and the purpose is to show reverse correlation between the two instruments. Remember it's likened to a seesaw, when up goes up the other should go down and vice versa.
Yesterday the ZT migrated Higher at around 8 AM EST. If you look at the charts below the ZT gave a signal at around 8 AM and started its Upward climb. Look at the charts below and you'll see a pattern for both assets. The Dow moved Lower at around 8 AM and the ZT moved Higher at around the same time. These charts represent the newest version of BarCharts and I've changed the timeframe to a 15-minute chart to display better. This represented a Long opportunity on the 2-year note, as a trader you could have netted about 20 plus ticks per contract on this trade. Each tick is worth $7.625. Please note: the front month for ZT is Sept and the Dow is now Sept '24. I've changed the format to filled Candlesticks (not hollow) such that it may be more apparent and visible.
Charts courtesy of barcharts
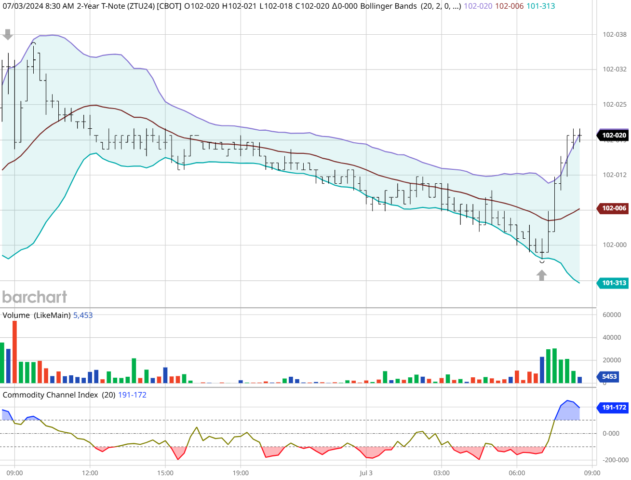
ZT -Sept 2024 - 07/03/24
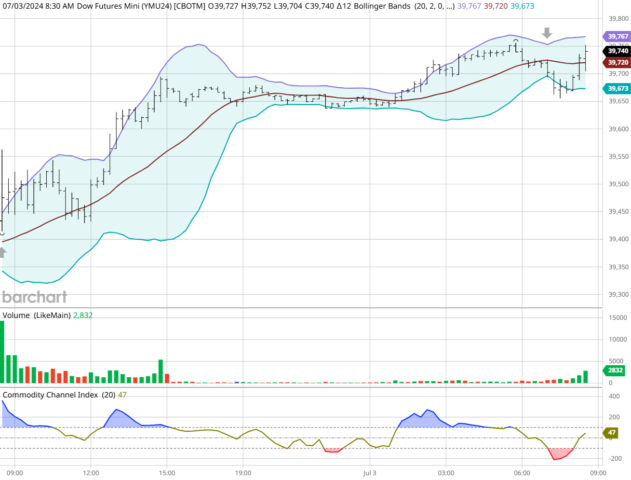
Dow - Sept 2024 - 07/03/24
Bias
On Wednesday we gave the markets a Mixed or Neutral bias and the markets didn't disappoint as the Dow traded Lower by 24 points, but the other indices climbed Higher. Given that today is a Jobs Friday, we will maintain a Neutral or Mixed bias as is our custom because the markets have never shown any sense of normalcy on Jobs Friday.
Could this change? Of Course. Remember anything can happen in a volatile market.
Commentary
Last Wednesday as suggested we gave the markets a Neutral or Mixed bias as we didn't see much in the way of Market Correlation. The markets didn't disappoint as teh indices closed Mixed on Wednesday. The Dow Lower but the other indices Higher. Despite the fact that yesterday was a major holiday we still have Non-Farm Payrolls to deal with today. I would say the volume will be light given that many will use this as a 4 day holiday weekend and many traders may not be available. That is pure subjection on my part but as in all things, only time will tell.
Author

Nick Mastrandrea
Market Tea Leaves


