All the CPI data came in line with expectation, so no falloff occurred [Video]
![All the CPI data came in line with expectation, so no falloff occurred [Video]](https://editorial.fxstreet.com/images/Macroeconomics/EconomicIndicator/Prices/CPI/tablet-with-consumer-price-index-cpi-business-concept-gm499730392-80399281_XtraLarge.jpg)
US Dollar: Mar '23 USD is Up at 102.170.
Energies: Feb '23 Crude is Up at 79.09.
Financials: The Mar '23 30 Year T-Bond is Down 9 ticks and trading at 130.12.
Indices: The Mar '23 S&P 500 Emini ES contract is 44 ticks Lower and trading at 3992.50.
Gold: The Feb'23 Gold contract is trading Up at 1905.60. Gold is 68 ticks Higher than its close.
Initial conclusion
This is not a correlated market. The dollar is Up, and Crude is Up which is not normal, but the 30 Year T-Bond is trading Lower. The Financials should always correlate with the US dollar such that if the dollar is lower, then the bonds should follow and vice-versa. The S&P is Lower, and Crude is trading Higher which is correlated. Gold is trading Higher which is not correlated with the US dollar trading Up. I tend to believe that Gold has an inverse relationship with the US Dollar as when the US Dollar is down, Gold tends to rise in value and vice-versa. Think of it as a seesaw, when one is up the other should be down. I point this out to you to make you aware that when we don't have a correlated market, it means something is wrong. As traders you need to be aware of this and proceed with your eyes wide open. Currently all of Asia is trading Higher with the exception of the Japanese Nikkei exchange which is Lower. All of Europe is trading Higher at this time.
Possible challenges to traders today
-
Import Prices are out at 8:30 AM EST. Major.
-
Prelim UoM Consumer Sentiment is out at 10 AM EST. Major.
-
Prelim UoM Inflation Expectations is out at 10 AM EST. Major.
Treasuries
Traders, please note that we've changed the Bond instrument from the 30 year (ZB) to the 10 year (ZN). They work exactly the same.
We've elected to switch gears a bit and show correlation between the 10-year bond (ZN) and the S&P futures contract. The S&P contract is the Standard and Poor's, and the purpose is to show reverse correlation between the two instruments. Remember it's likened to a seesaw, when up goes up the other should go down and vice versa.
Yesterday the ZN hit a Low at around 10:15 AM EST. The S&P was trading Lower at around the same time. If you look at the charts below ZN gave a signal at around 10 AM and the S&P gave a signal at around the same time. Look at the charts below and you'll see a pattern for both assets. ZN hit a High at around 10 AM and migrated Lower. These charts represent the newest version of MultiCharts and I've changed the timeframe to a 15-minute chart to display better. This represented a Short opportunity on the 10-year note, as a trader you could have netted about a dozen ticks per contract on this trade. Each tick is worth $15.625. Please note: the front month for the ZN is now Mar '23. The S&P contract is now Mar' 23 as well. I've changed the format to filled Candlesticks (not hollow) such that it may be more apparent and visible.
Charts courtesy of MultiCharts built on an AMP platform
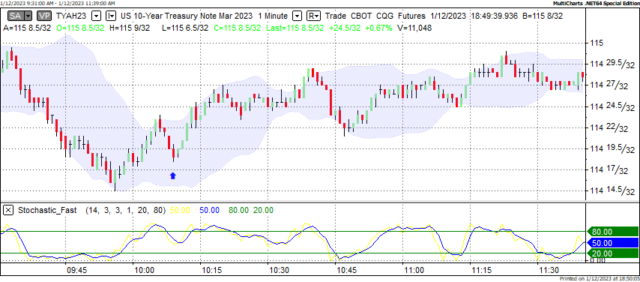
ZN - Mar 2023 - 1/12/23
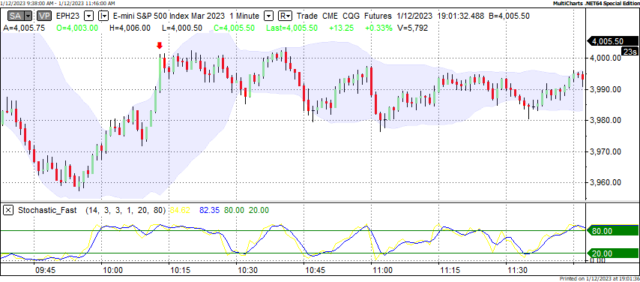
S&P - Mar 2023 - 1/12/23
Bias
Yesterday gave the markets a Neutral bias as we didn't see much in the way of correlation Thursday morning. The markets migrated to the Upside as the Dow closed 217 points Higher and the other indices closed Higher as well. Today we aren't dealing with a correlated market and our bias is to the Downside.
Could this change? Of Course. Remember anything can happen in a volatile market.
Commentary
Yesterday morning we awoke to see no correlation amongst the various instruments that we use for Market Correlation purposes. The chief news yesterday was the various CPI data reported. No doubt the Federal Reserve will use this information to determine interest rate hikes going forward. All the CPI data came in line with expectation, so no falloff occurred. Today we have Preliminary Inflation and Consumer confidence numbers.
Author

Nick Mastrandrea
Market Tea Leaves


