All down but the Dow, again
USD: Sept '24 is Down at 105.180.
Energies: Jul '24 Crude is Up at 81.01.
Financials: The Sept '24 30 Year T-Bond is Down 5 ticks and trading at 119.20.
Indices: The Sept '24 S&P 500 emini ES contract is 26 ticks Higher and trading at 5540.75.
Gold: The Aug'24 Gold contract is trading Up at 2338.00
Initial conclusion
This is not a correlated market. The USD is Down and Crude is Up which is normal, and the 30 Year T-Bond is trading Down. The Financials should always correlate with the US dollar such that if the dollar is Higher, then the bonds should follow and vice-versa. The S&P is Higher and Crude is trading Higher which is not correlated. Gold is trading Higher which is correlated with the US dollar trading Down. I tend to believe that Gold has an inverse relationship with the US Dollar as when the US Dollar is down, Gold tends to rise in value and vice-versa. Think of it as a seesaw, when one is up the other should be down. I point this out to you to make you aware that when we don't have a correlated market, it means something is wrong. As traders you need to be aware of this and proceed with your eyes wide open. Asia traded Mixed. Currently all of Europe is trading Higher.
Possible challenges to traders
-
FOMC Member Daly Speaks at 2 PM EST. This is Major.
-
No Major Economic news to speak of.
-
Lack of Major Economic news
Traders, please note that we've changed the Bond instrument from the 10 year (ZN) to the 2 year (ZT). They work exactly the same.
We've elected to switch gears a bit and show correlation between the 10-year Treasury notes (ZN) and the S&P futures contract. The YM contract is the Dow Jones Industrial Average, and the purpose is to show reverse correlation between the two instruments. Remember it's likened to a seesaw, when up goes up the other should go down and vice versa.
Yesterday the ZT migrated Lower at around 8:30 AM EST after the PMI (Purchasing Managers Index) numbers was reported. If you look at the charts below the ZT gave a signal at around 8:30 AM and started its Downward slide. Look at the charts below and you'll see a pattern for both assets. The Dow moved Higher at around 8:30 AM and the ZT moved Lower at around the same time. These charts represent the newest version of BarCharts and I've changed the timeframe to a 15-minute chart to display better. This represented a Short opportunity on the 2-year note, as a trader you could have netted about 30 ticks per contract on this trade. Each tick is worth $7.625. Please note: the front month for ZT is Sept and the Dow is now Sept '24. I've changed the format to filled Candlesticks (not hollow) such that it may be more apparent and visible.
Charts courtesy of barcharts
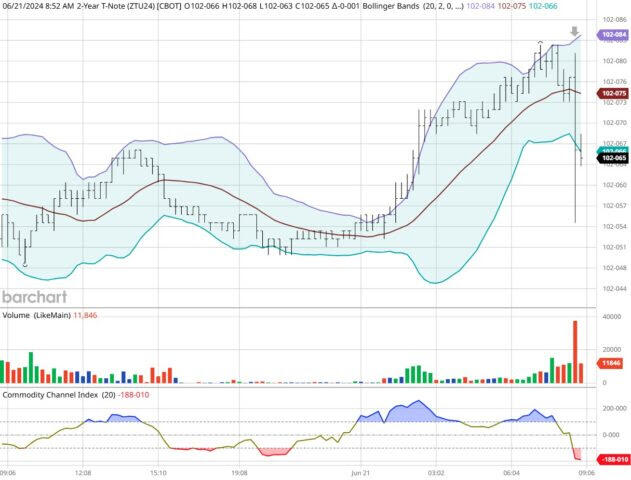
ZT -Sept 2024 - 06/21/24
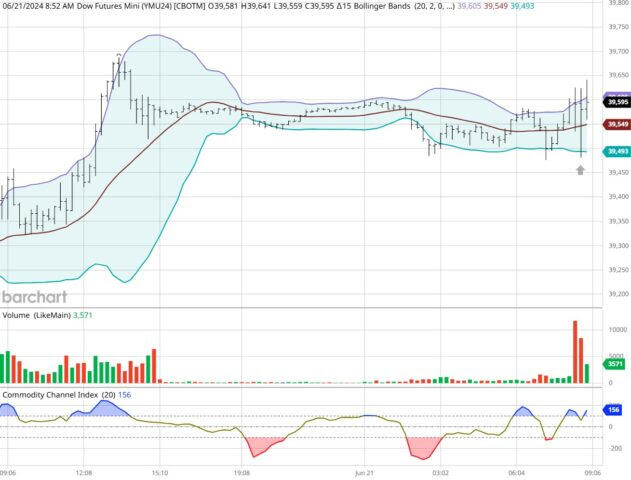
Dow - Sept 2024 - 06/21/24
Bias
On Friday, we gave the markets a Downside bias as the USD and the Bonds were Higher Friday morning and that usually reflects a Downside Day. The markets for the most part didn't disappoint as the indices (for the most part) closed Lower on Friday with the exception of the Dow which closed 16 points Higher. Today we aren't dealing with a correlated market and our bias is to the Upside.
Could this change? Of Course. Remember anything can happen in a volatile market.
Commentary
So, Friday came and went, and a funny thing happened in the markets. The PMI numbers were reported at 8:30 AM EST Friday morning and the Dow leaped Higher as the numbers were better than expected. Remember this is the Purchasing Managers Index which reflects buying activity. The Higher the number the more activity there is and that is considered positive for the markets. Believe me if things were that bad those numbers would be far lower. In a previous life I worked as a Production Planner and Planning Manager. If we had lower activity and lower demand for the firm's products, I wouldn't be placing requisitions with Purchasing to buy raw materials or components. The indices for the most part did trade Lower (except the Dow) as expected. Today we have very limited activity in terms of economic reports. We do have an FOMC member speaking this afternoon and perhaps he can provide some direction going forward but we shall see.
Author

Nick Mastrandrea
Market Tea Leaves


