USD: Sept '24 is Up at 105.445.

Energies: Jul '24 Crude is Down at 81.11.

Financials: The Sept '24 30 Year T-Bond is Up 10 ticks and trading at 120.04.

Indices: The Sept '24 S&P 500 emini ES contract is 28 ticks Lower and trading at 5537.50.

Gold: The Aug'24 Gold contract is trading Up at 2379.50  

Initial conclusion

This is not a correlated market. The USD is Up and Crude is Down which is normal, and the 30 Year T-Bond is trading Up. The Financials should always correlate with the US dollar such that if the dollar is Higher, then the bonds should follow and vice-versa. The S&P is Lower and Crude is trading Lower which is not correlated. Gold is trading Higher which is not correlated with the US dollar trading Up.  I tend to believe that Gold has an inverse relationship with the US Dollar as when the US Dollar is down, Gold tends to rise in value and vice-versa. Think of it as a seesaw, when one is up the other should be down. I point this out to you to make you aware that when we don't have a correlated market, it means something is wrong. As traders you need to be aware of this and proceed with your eyes wide open. Asia is trading mainly Lower. Currently all of Europe is trading Lower. 

Possible challenges to traders

  • Flash Manufacturing PMI is out at 9:45 AM EST.  This is Major.

  • Flash Services PMI is out at 9:45 AM EST.  This is Major.

  • Existing Home Sales is out at 10 AM EST.  This is Major.

  • CB Leading Index m/m is out at 10 AM EST.  This is Major.

  • Natural Gas Storage is out at 10:30 AM EST.  This is Major.

Traders, please note that we've changed the Bond instrument from the 10 year (ZN) to the 2 year (ZT).  They work exactly the same.  

We've elected to switch gears a bit and show correlation between the 10-year Treasury notes (ZN) and the S&P futures contract.  The YM contract is the Dow Jones Industrial Average, and the purpose is to show reverse correlation between the two instruments. Remember it's likened to a seesaw, when up goes up the other should go down and vice versa.  

Yesterday the ZT migrated Lower at around 8:30 AM EST when all the 8:30 news was reported.  If you look at the charts below the ZT gave a signal at around 8:30 AM and started its Downward slide.  Look at the charts below and you'll see a pattern for both assets. The Dow moved Higher at around 8:30 AM and the ZT moved Lower at around the same time.  These charts represent the newest version of BarCharts and I've changed the timeframe to a 15-minute chart to display better.  This represented a Short opportunity on the 2-year note, as a trader you could have netted about 30 ticks per contract on this trade.   Each tick is worth $7.625.  Please note: the front month for ZT is Sept and the S&P is now Sept '24.  This will be the last time we show a June contract for the Dow.  I've changed the format to filled Candlesticks (not hollow) such that it may be more apparent and visible.  

Charts courtesy of barcharts

ZT

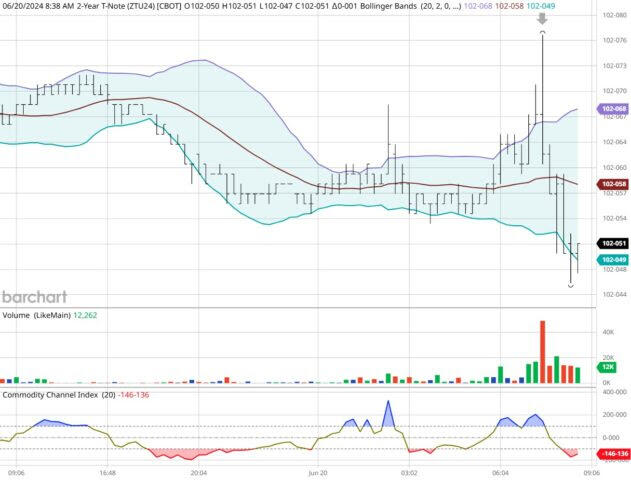
ZT -Sept 2024 - 06/20/24

Dow

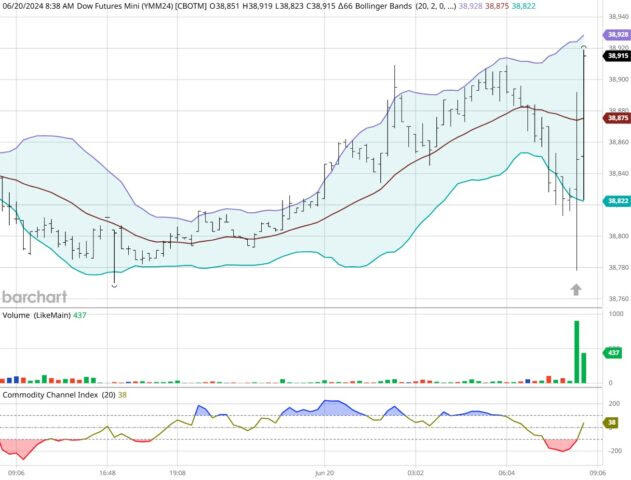
Dow - Jun 2024 - 06/20/24

Bias

Yesterday, we gave the markets an Upside bias as the Bonds were trading Lower and that usually signifies an Upside Day.  We were partially correct in that the Dow gained about 300 points on the day however, the other indices lost ground and fell.  Today we aren't dealing with a correlated market and our bias is to the Downside.

Could this change? Of Course.  Remember anything can happen in a volatile market. 

Commentary

Yesterday we gave the markets an Upside bias as the bonds were trading Lower (and that usually reflects an Upside Day) but additionally it was the day after a holiday in the US and the markets were closed for Juneteeth Day.  Usually (but not always) when the markets are closed for a holiday, we see the situation where there is pent up demand for either buying or selling.  Yesterday it appeared as though the demand was for buying hence the Upside bias.  Today we have Existing Home Sales, Flash Manufacturing PMI and Services.  These are major and proven market movers.

Trading performance displayed herein is hypothetical. The following Commodity Futures Trading Commission (CFTC) disclaimer should be noted.

Hypothetical performance results have many inherent limitations, some of which are described below. No representation is being made that any account will or is likely to achieve profits or losses similar to those shown.

In fact, there are frequently sharp differences between hypothetical performance results and the actual results subsequently achieved by any particular trading program. One of the limitations of hypothetical performance trading results is that they are generally prepared with the benefit of hindsight.

In addition, hypothetical trading does not involve financial risk, and no hypothetical trading record can completely account for the impact of financial risk in actual trading. For example, the ability to withstand losses or to adhere to a particular trading program in spite of trading losses are material points which can also adversely affect actual trading results.

There are numerous other factors related to the markets in general or to the implementation of any specific trading program which cannot be fully accounted for in the preparation of hypothetical performance results and all of which can adversely affect actual trading results.

Trading in the commodities markets involves substantial risk and YOU CAN LOSE A LOT OF MONEY, and thus is not appropriate for everyone. You should carefully consider your financial condition before trading in these markets, and only risk capital should be used.

In addition, these markets are often liquid, making it difficult to execute orders at desired prices. Also, during periods of extreme volatility, trading in these markets may be halted due to so-called “circuit breakers” put in place by the CME to alleviate such volatility. In the event of a trading halt, it may be difficult or impossible to exit a losing position.

Recommended Content


Recommended Content

Editors’ Picks

AUD/USD stays directed toward 0.6700 after strong Aussie data, weak China's PMI

AUD/USD stays directed toward 0.6700 after strong Aussie data, weak China's PMI

AUD/USD holds higher ground toward 0.6700 in Asian trading on Wednesday. The pair finds fresh bullish impetus after the Australian Retail Sales data beat estimates with 0.6% YoY in May. Weak China's Caixin Services PMI data fails to deter Aussie buyers. Eyes turn to US data and Fed Minutes. 

AUD/USD News

USD/JPY extends gains above 161.50 ahead of US data, Fed Minutes

USD/JPY extends gains above 161.50 ahead of US data, Fed Minutes

USD/JPY trades on a stronger note above 161.50 after reaching a new high for this move near 161.75 during the early Asian trading hours on Wednesday. Market players remain focused on the possible Japanese FX intervention, which could cap the pair’s upside. US data and Fed Minutes awaited. 

USD/JPY News

Gold price remains confined in a range below 50-day SMA, FOMC minutes in focus

Gold price remains confined in a range below 50-day SMA, FOMC minutes in focus

Gold price continues with its struggle to gain any meaningful traction on Wednesday. Traders seem reluctant and prefer to wait for more cues about the Fed’s rate-cut path. Investors look to FOMC minutes for some impetus ahead of the NFP report on Friday.

Gold News

Celebrity meme coins controversy continues amid Pump.fun revenue dominance

Celebrity meme coins controversy continues amid Pump.fun revenue dominance

Meme coin generation platform Pump.fun outperformed the Ethereum blockchain in daily revenue on Tuesday after raking in $1.99 million. Following this achievement, a celebrity meme coin based on actress Sydney Sweeney was the subject of controversy after its developers dumped their bags on investors.

Read more

Benefit of the doubt: US consumer confidence and elections

Benefit of the doubt: US consumer confidence and elections

Despite widespread expectation for the US economy to be in recession in 2024, that fate has been avoided thanks to a resilient consumer. Yet it is difficult to square this undaunted spending with consumer confidence and sentiment readings that are lackluster at best.

Read more

Majors

Cryptocurrencies

Signatures