A Silver tea cup – This epic 45-year Silver pattern should have traders drooling

Gold has been on quite a bull run this year, but silver has lagged.
The wide gold-silver ratio tells us that silver is historically underpriced compared to gold, and it’s clear that the white metal isn’t priced for the supply and demand dynamics.
What gives?
In 1981, Roy Jastram wrote a book titled 'Silver: The Restless Metal'. This perfectly captures the difficulty of nailing down the trajectory of silver.
One factor that complicates things is that silver serves two very different roles.
A little over 50 percent of silver demand comes from industrial offtake, and with the rapidly expanding “green economy,” this percentage will likely climb. Industrial metals are sensitive to a host of economic factors including the overall trajectory of the global economy. Recessions typically put downward price pressures on metals.
But at its core, silver is a monetary metal, and it tends to generally track with gold over time – albeit in a more volatile manner.
Untangling these various factors presents a significant challenge for silver investors.
Looking into a hazy crystal ball
Economic and market forecasting is a tricky business in any environment. We may have a crystal ball, but it is rather opaque and hazy.
At its core, economics is about causes and their predictable effects. For instance, we know that raising a price will lower demand all other things being equal.
Because causes and effects are at least somewhat predictable, we can identify patterns in markets. As an example, knowing that artificially low interest rates create inflationary pressures offers insight into how gold and silver will behave in a lower interest rate environment.
The challenge is untangling various factors and policies operating simultaneously in a complex economy. Causes and effects can cancel each other out, making market forecasting extremely difficult.
So, how do we predict the eventual outcome?
Humility demands we always remember we can’t. It’s impossible to know all that there is to know. But there are tools that will provide insight and guidance.
History provides one way to help untangle the mess. This is why analysts often turn to technical charts. They reveal patterns that often repeat. By identifying patterns, we can gain insight into how things might be playing out.
What can price charts tell us about Silver?
If we look at a 50-year price chart for silver, we see a very distinctive pattern known as a “secular cup and handle.”
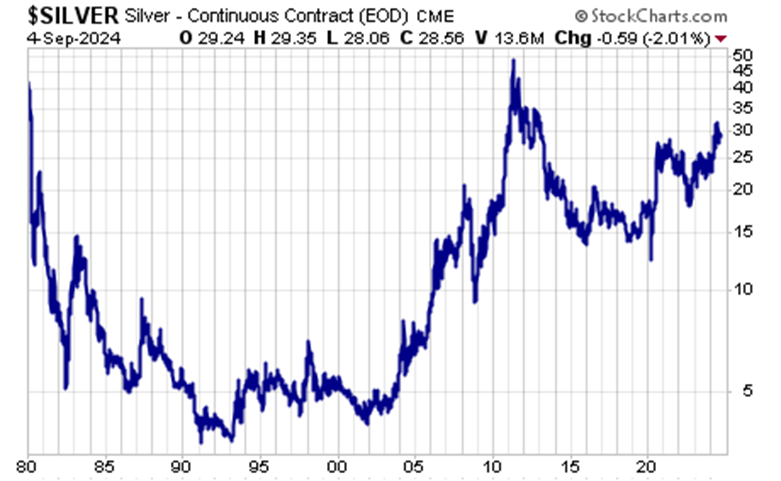
This is a long-term bullish pattern. You can see the “cup” with the twin highs of around $50 per ounce in 1980 and 2011. Following the 2011 peak, we see a sharp decline in the price followed by a consolidation “handle.”
A handle pattern on the chart of a stock or commodity often precedes a breakout.
This cup-and-handle pattern has played out over an extremely long timeframe. Historically, longer patterns portend bigger breakouts with a broader base signaling a bigger upside case.
Gold followed a similar long-term pattern, resolving with a breakout to new all-time highs last year.
Silver has lagged gold’s performance, but that is actually a common occurrence. Whatever silver lacks at the beginning of a precious metals bull market, it typically makes up for it at the end.
If history is any indication, silver may soon follow gold’s lead.
After gold’s recent breakout above $2,500 per ounce, gold’s continued strength above that key level should act like a magnet to pull silver toward the $50 level. Should it occur, a decisive break above $50 silver would complete an epic, 45-year cup-and-handle pattern, and market technicians would then look for a slingshot move higher from there.
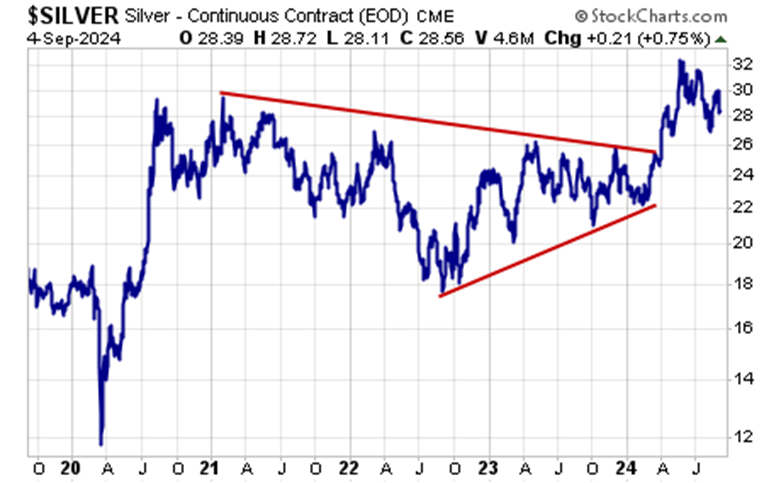
Zooming into a five-year chart, we can clearly see silver breaking out from its post-pandemic consolidation wedge.
Putting it all together
As the saying goes, history doesn’t always repeat, but it often rhymes. When we see these kinds of patterns emerge, one should sit up and take notice.
This is especially true when it coincides with the fundamentals.
As I already mentioned, the gold-silver ratio is historically wide at 87:1, meaning that it takes 87 ounces of silver to buy an ounce of gold. To put that into perspective, the average in the modern era has been between 40:1 and 60:1.
In other words, from a historical perspective, silver is underpriced.
Historically, the ratio has always returned to the mean. And it has done so with a vengeance, overshooting that mean. The ratio fell to 30:1 in 2011 and below 20:1 in 1979.
On the supply side, we’ve seen silver market deficits for the past three years, and Metals Focus projects demand to outstrip production again this year.
When you put the technical factors together with the fundamentals, there appears to be an extremely strong bullish case for silver with significant upside.
To receive free commentary and analysis on the gold and silver markets, click here to be added to the Money Metals news service.
Author

Mike Maharrey
Money Metals Exchange
Mike Maharrey is a journalist and market analyst for MoneyMetals.com with over a decade of experience in precious metals. He holds a BS in accounting from the University of Kentucky and a BA in journalism from the University of South Florida.


