USD: Sept '24 is Up at 100.900.

Energies: Oct '24 Crude is Down at 74.15.

Financials: The Dec '24 30 Year T-Bond is Up 10 ticks and trading at 124.21.

Indices: The Sept '24 S&P 500 emini ES contract is 3 ticks Lower and trading at 5644.00.

Gold: The Dec'24 Gold contract is trading Down at 2540.70.

Initial conclusion

This is not a correlated market.  The USD is Up and Crude is Down which is normal, and the 30 Year T-Bond is trading Up.  The Financials should always correlate with the US dollar such that if the dollar is Higher, then the bonds should follow and vice-versa. The S&P is Lower and Crude is trading Lower which is not correlated. Gold is trading Lower which is correlated with the US dollar trading Up.  I tend to believe that Gold has an inverse relationship with the US Dollar as when the US Dollar is down, Gold tends to rise in value and vice-versa. Think of it as a seesaw, when one is up the other should be down. I point this out to you to make you aware that when we don't have a correlated market, it means something is wrong. As traders you need to be aware of this and proceed with your eyes wide open.  Asia trading mainly Mixed with half the exchanges Higher and the other half Lower.  Europe is trading Mixed with the London and Spanish Ibex trading Lower at the present time..

Possible challenges to traders

  • Crude Oil Inventories are out at 10:30 AM EST. This is Major.

  • Lack of Major Economic News.

Traders, please note that we've changed the Bond instrument from the 10 year (ZN) to the 2 year (ZT).  They work exactly the same.  

We've elected to switch gears a bit and show correlation between the 2-year Treasury notes (ZT) and the S&P futures contract.  The YM contract is the Dow Jones Industrial Average, and the purpose is to show reverse correlation between the two instruments.  Remember it's likened to a seesaw, when up goes up the other should go down and vice versa.

Yesterday the ZT migrated Higher at around 8:45 AM EST.  If you look at the charts below the ZT gave a signal at around 8:45 AM with no real news and started its Upward climb.  Look at the charts below and you'll see a pattern for both assets. The Dow moved Lower at 8:45 AM and the ZT moved Higher at around the same time.  These charts represent the newest version of BarCharts, and I've changed the timeframe to a 15-minute chart to display better.  This represented a Long opportunity on the 2-year note, as a trader you could have netted about 30 plus ticks per contract on this trade.   Each tick is worth $7.625.  Please note: the front month for ZT is Sept and the Dow is now Sept '24.  I've changed the format to filled Candlesticks (not hollow) such that it may be more apparent and visible.

Charts courtesy of Barcharts

Chart

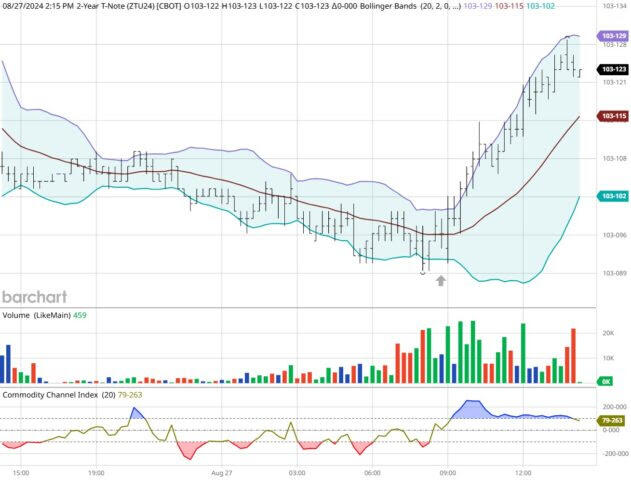
ZT -Sept 2024 - 08/27/24\

Chart

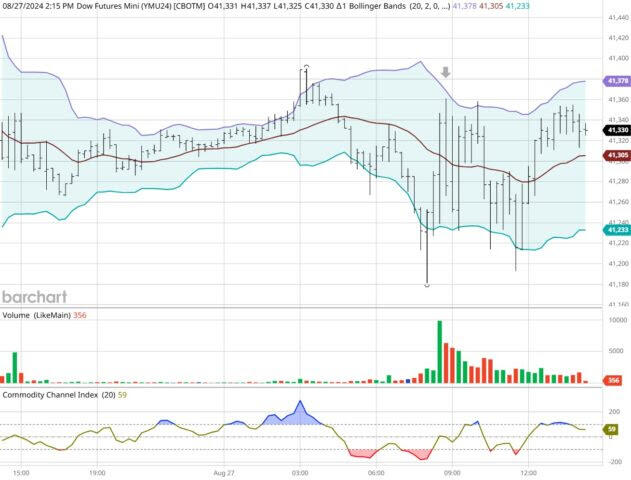
Dow - Sept 2024- 08/27/24

Bias

Yesterday we gave the markets a Neutral or Mixed bias as we saw no correlation at all Tuesday morning.  Every instrument was pointed Lower and whenever that happens there is no market correlation to speak of.  The Dow closed about 10 points Higher and the other indices traded Higher as well.  Today we aren't dealing with a correlated market and the bias is Neutral or Mixed.

Could this change? Of Course. Remember anything can happen in a volatile market. 

Commentary

So yesterday we witnessed all instruments pointed Lower.  Unfortunately the indices didn't point Higher.  We rarely ever see this type of situation but whenever everything is pointed Lower or conversely pointed Higher; you aren't dealing with a correlated market and need to proceed with caution as the markets could go in any direction and often does.  If you bring up a chart of the DJIA from yesterday, you would notice that it was very erratic almost like a yoyo going Up and Down.  Today we are light on economic news as we have Crude Oil inventories out at 10:30 AM EST and that's about it.

Trading performance displayed herein is hypothetical. The following Commodity Futures Trading Commission (CFTC) disclaimer should be noted.

Hypothetical performance results have many inherent limitations, some of which are described below. No representation is being made that any account will or is likely to achieve profits or losses similar to those shown.

In fact, there are frequently sharp differences between hypothetical performance results and the actual results subsequently achieved by any particular trading program. One of the limitations of hypothetical performance trading results is that they are generally prepared with the benefit of hindsight.

In addition, hypothetical trading does not involve financial risk, and no hypothetical trading record can completely account for the impact of financial risk in actual trading. For example, the ability to withstand losses or to adhere to a particular trading program in spite of trading losses are material points which can also adversely affect actual trading results.

There are numerous other factors related to the markets in general or to the implementation of any specific trading program which cannot be fully accounted for in the preparation of hypothetical performance results and all of which can adversely affect actual trading results.

Trading in the commodities markets involves substantial risk and YOU CAN LOSE A LOT OF MONEY, and thus is not appropriate for everyone. You should carefully consider your financial condition before trading in these markets, and only risk capital should be used.

In addition, these markets are often liquid, making it difficult to execute orders at desired prices. Also, during periods of extreme volatility, trading in these markets may be halted due to so-called “circuit breakers” put in place by the CME to alleviate such volatility. In the event of a trading halt, it may be difficult or impossible to exit a losing position.

Recommended Content


Recommended Content

Editors’ Picks

EUR/USD slides toward 1.1100 as USD recovery continues

EUR/USD slides toward 1.1100 as USD recovery continues

EUR/USD stays under bearish pressure and declines toward 1.1100 on Wednesday. The cautious market mood, as reflected by the mixed action seen in Wall Street, supports the US Dollar and forces the pair to stay on the back foot.

EUR/USD News
GBP/USD drops below 1.3200 on renewed USD strength

GBP/USD drops below 1.3200 on renewed USD strength

GBP/USD struggles to hold its ground and trades below 1.3200 on Wednesday, undermined by a broad US Dollar rebound. Markets turn anxious ahead of speeches from the BoE and the Fed policymakers later in the day. 

GBP/USD News
Gold tries to stabilize above $2,500

Gold tries to stabilize above $2,500

After falling toward $2,490 earlier in the day, Gold staged a rebound and trades above $2,500. Renewed US Dollar strength and US Treasury bond yields' resilience, however, caps XAU/USD's upside. 

Gold News
Nvidia Q2 Earnings Preview: All eyes on NVDA after close

Nvidia Q2 Earnings Preview: All eyes on NVDA after close Premium

The moment is almost here. Despite a number of showstopping earnings calls this season, everyone has been waiting for Nvidia (NVDA) to release fiscal 2025 Q2 results, which finally arrive after the closing bell on Wednesday.

Read more
Three fundamentals for the week: Focus on the fragility of the US economy

Three fundamentals for the week: Focus on the fragility of the US economy Premium

US Consumer confidence data will provide a gauge of how consumers are feeling. Jobless claims are in focus after Fed Chair Powell's dovish speech. Investors will look to the core PCE index to confirm that inflation is falling.

Read more
Moneta Markets review 2024: All you need to know

Moneta Markets review 2024: All you need to know

VERIFIED In this review, the FXStreet team provides an independent and thorough analysis based on direct testing and real experiences with Moneta Markets – an excellent broker for novice to intermediate forex traders who want to broaden their knowledge base.

Read More

Majors

Cryptocurrencies

Signatures