A futures spread

S2N spotlight
A few days ago I mentioned that I was sure that there are statistical arbitrages available along different futures chains. Today’s spotlight might not interest all of you, but I felt compelled to do a bit more analysis and see what I could find.
With my Norgate data subscription, I have access to every symbol’s historic and active futures chain. I figured I could build a spread through 10 years of data looking at the spread between the closest pair, and then the next closest pair and the next pair to see how stable spreads are, working with 3 distance groupings away from spot.
Let me explain what I mean.
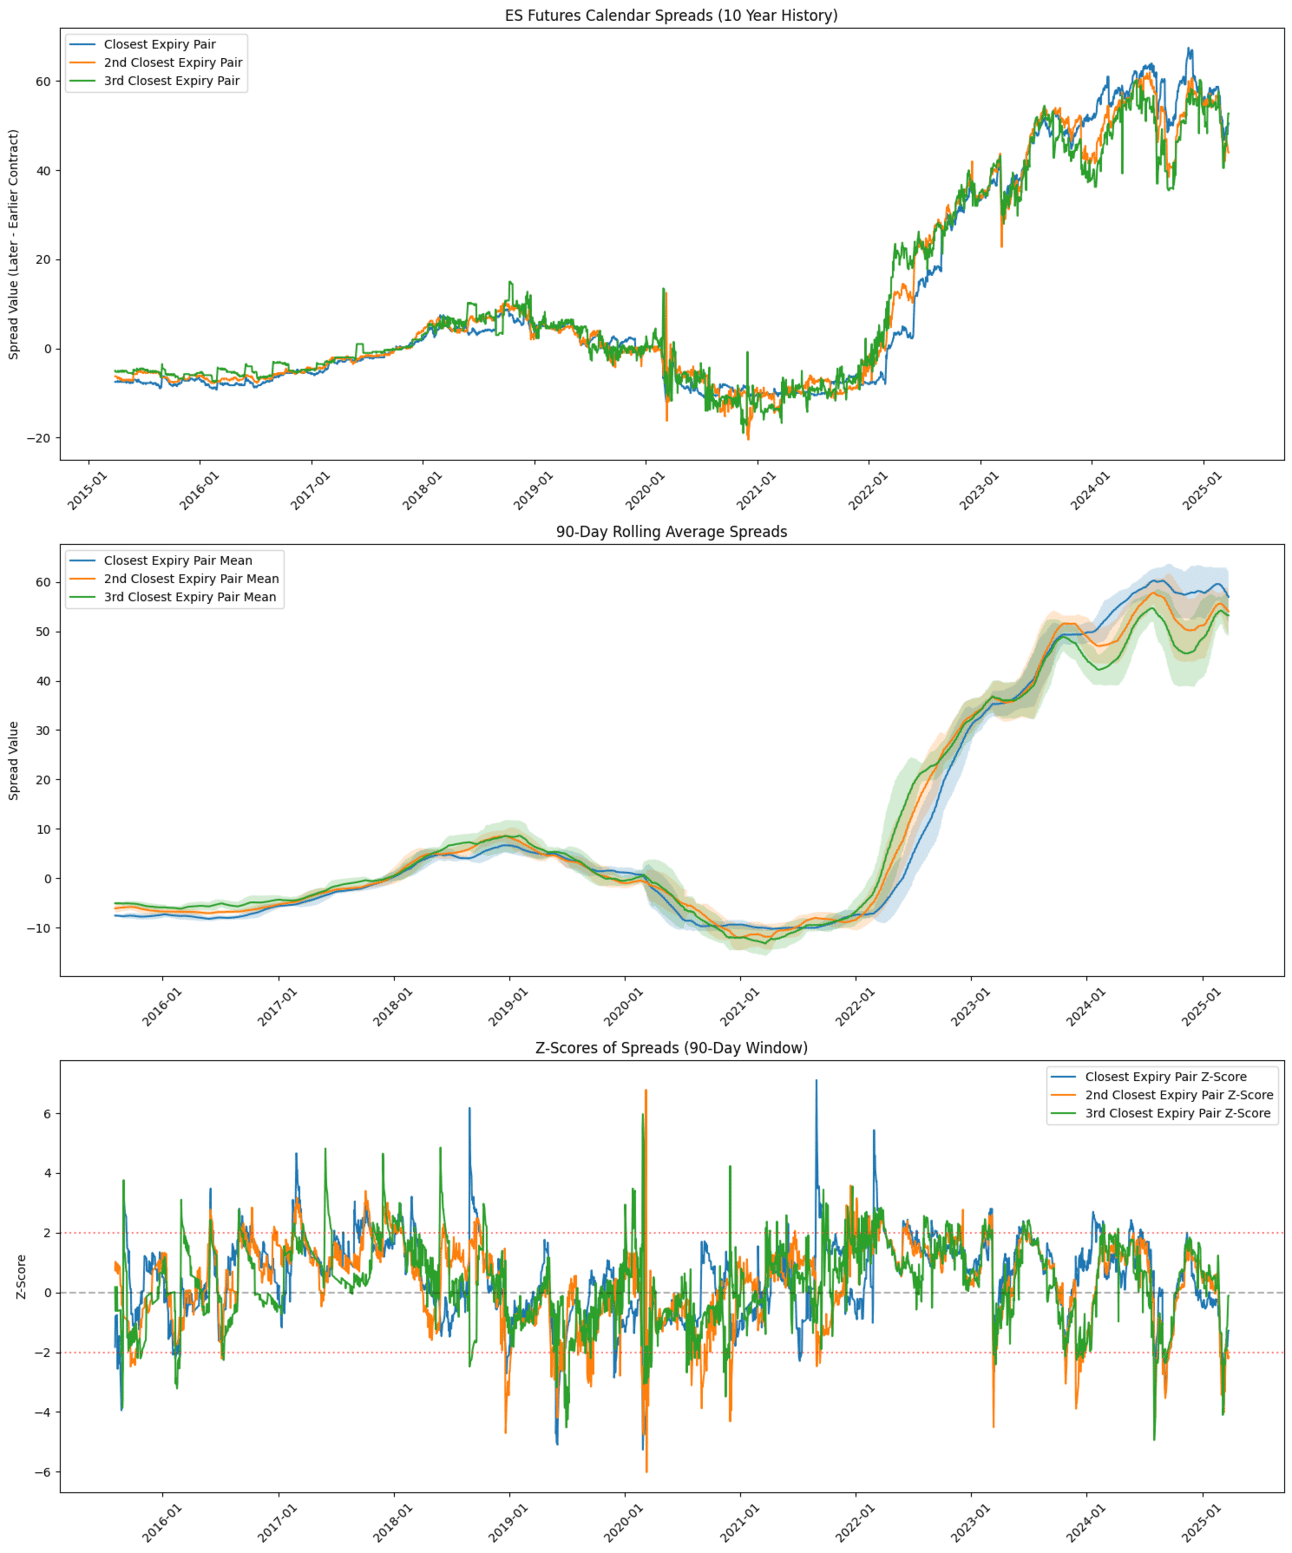
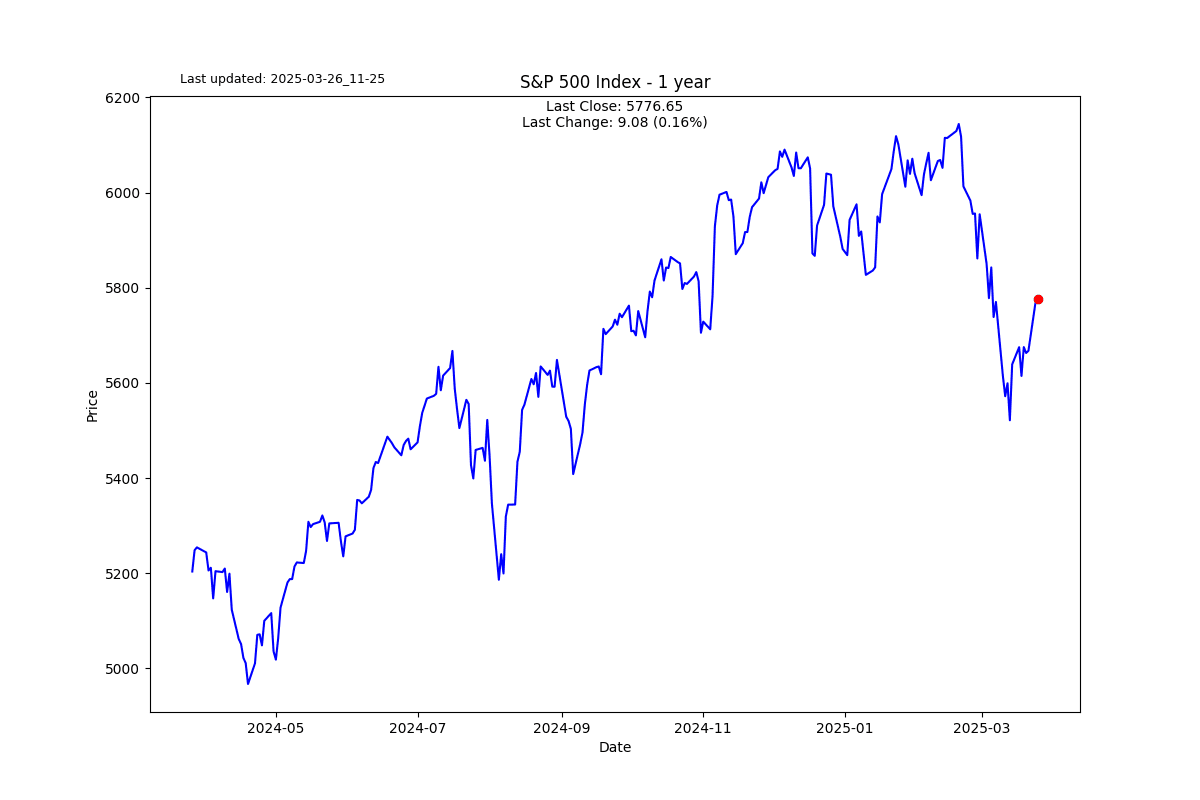
Assuming we are looking at the S&P 500 E-mini, ES. Today’s date is 26 March 2025 (spot). The closest pair is the June 2025 and September 2025 pair. The next closest are Sep 2025 and December 2025, and finally the last one in my grouping would be Dec 2025 and March 2026. This process just steps through time daily over a 10-year period, and is not fixed to a month or a year.
I will start with the E-mini, as with financial products, there is no physical delivery like commodities. My grasp is not quite there yet; I am still perplexed by a few things. What I find informative is how the Z-score spreads produce regular and decent enough spikes, i.e., +-2. I am not sure if including the 90-day rolling averages is signal or noise.
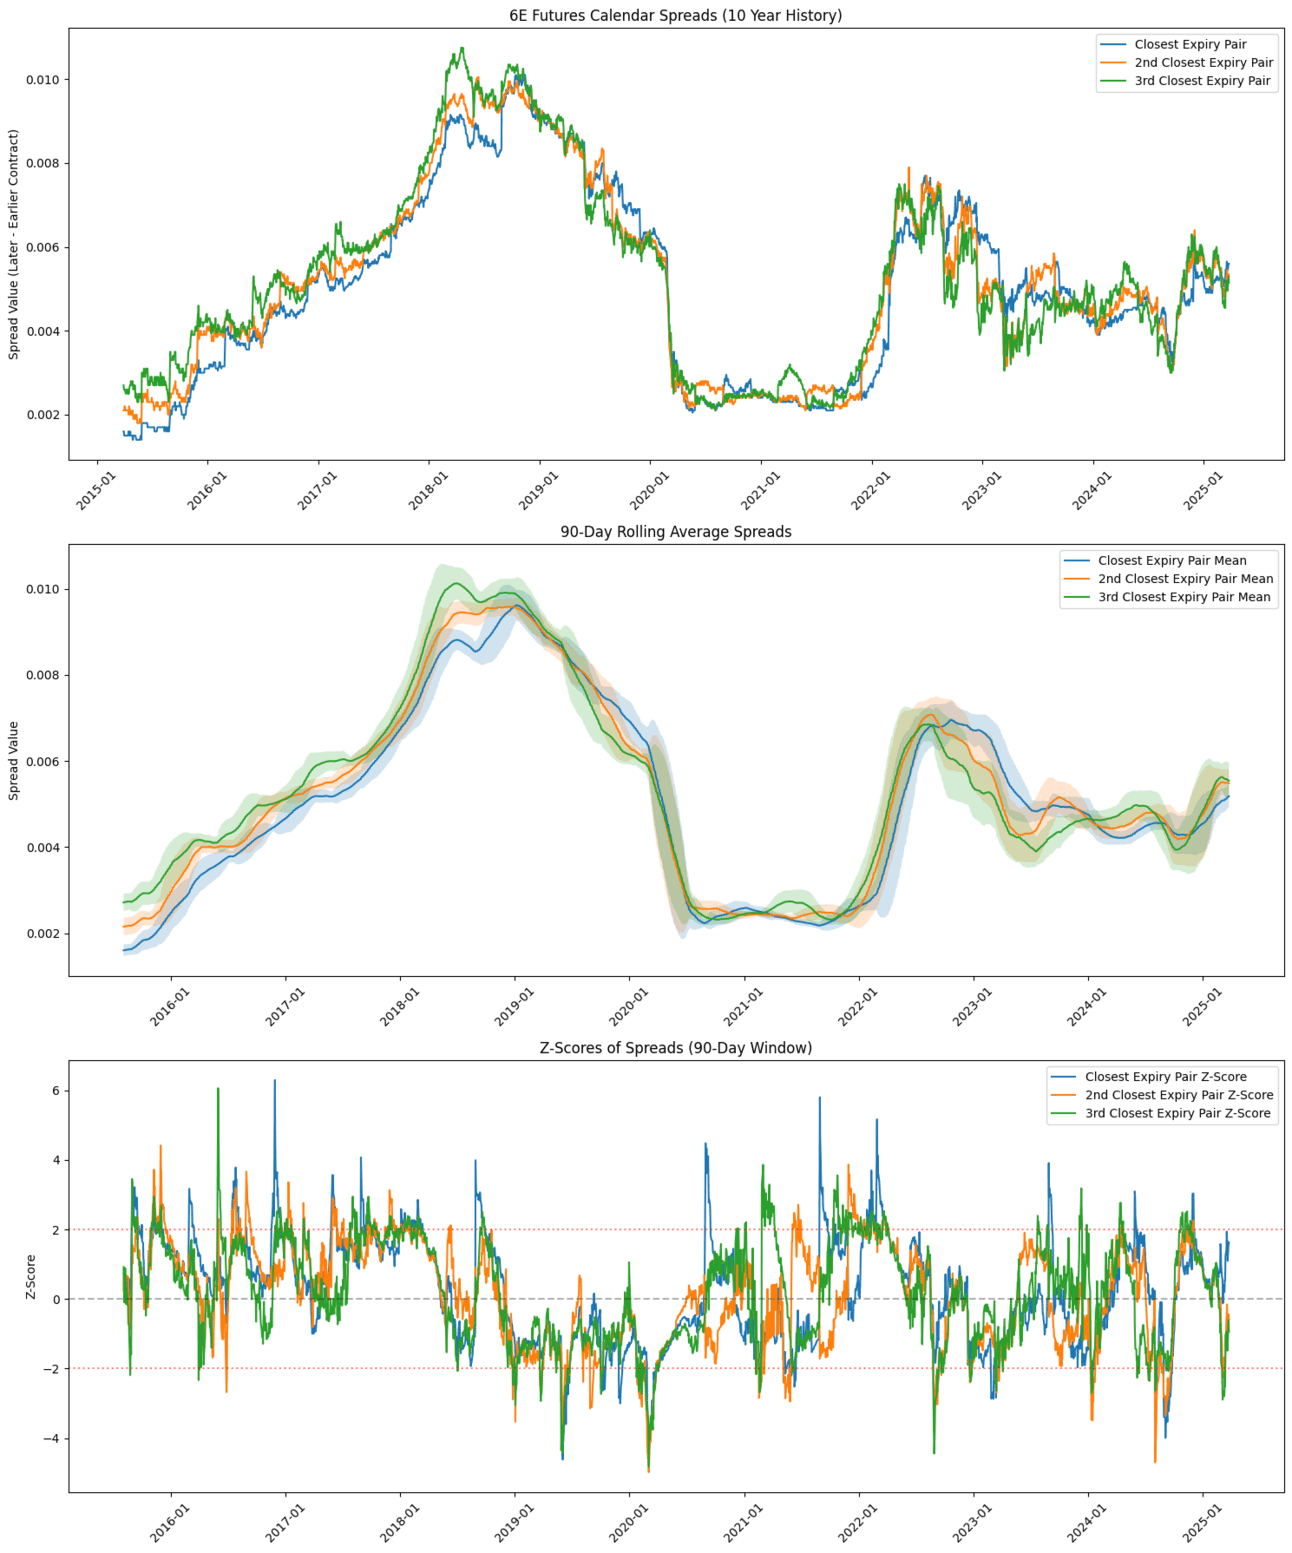
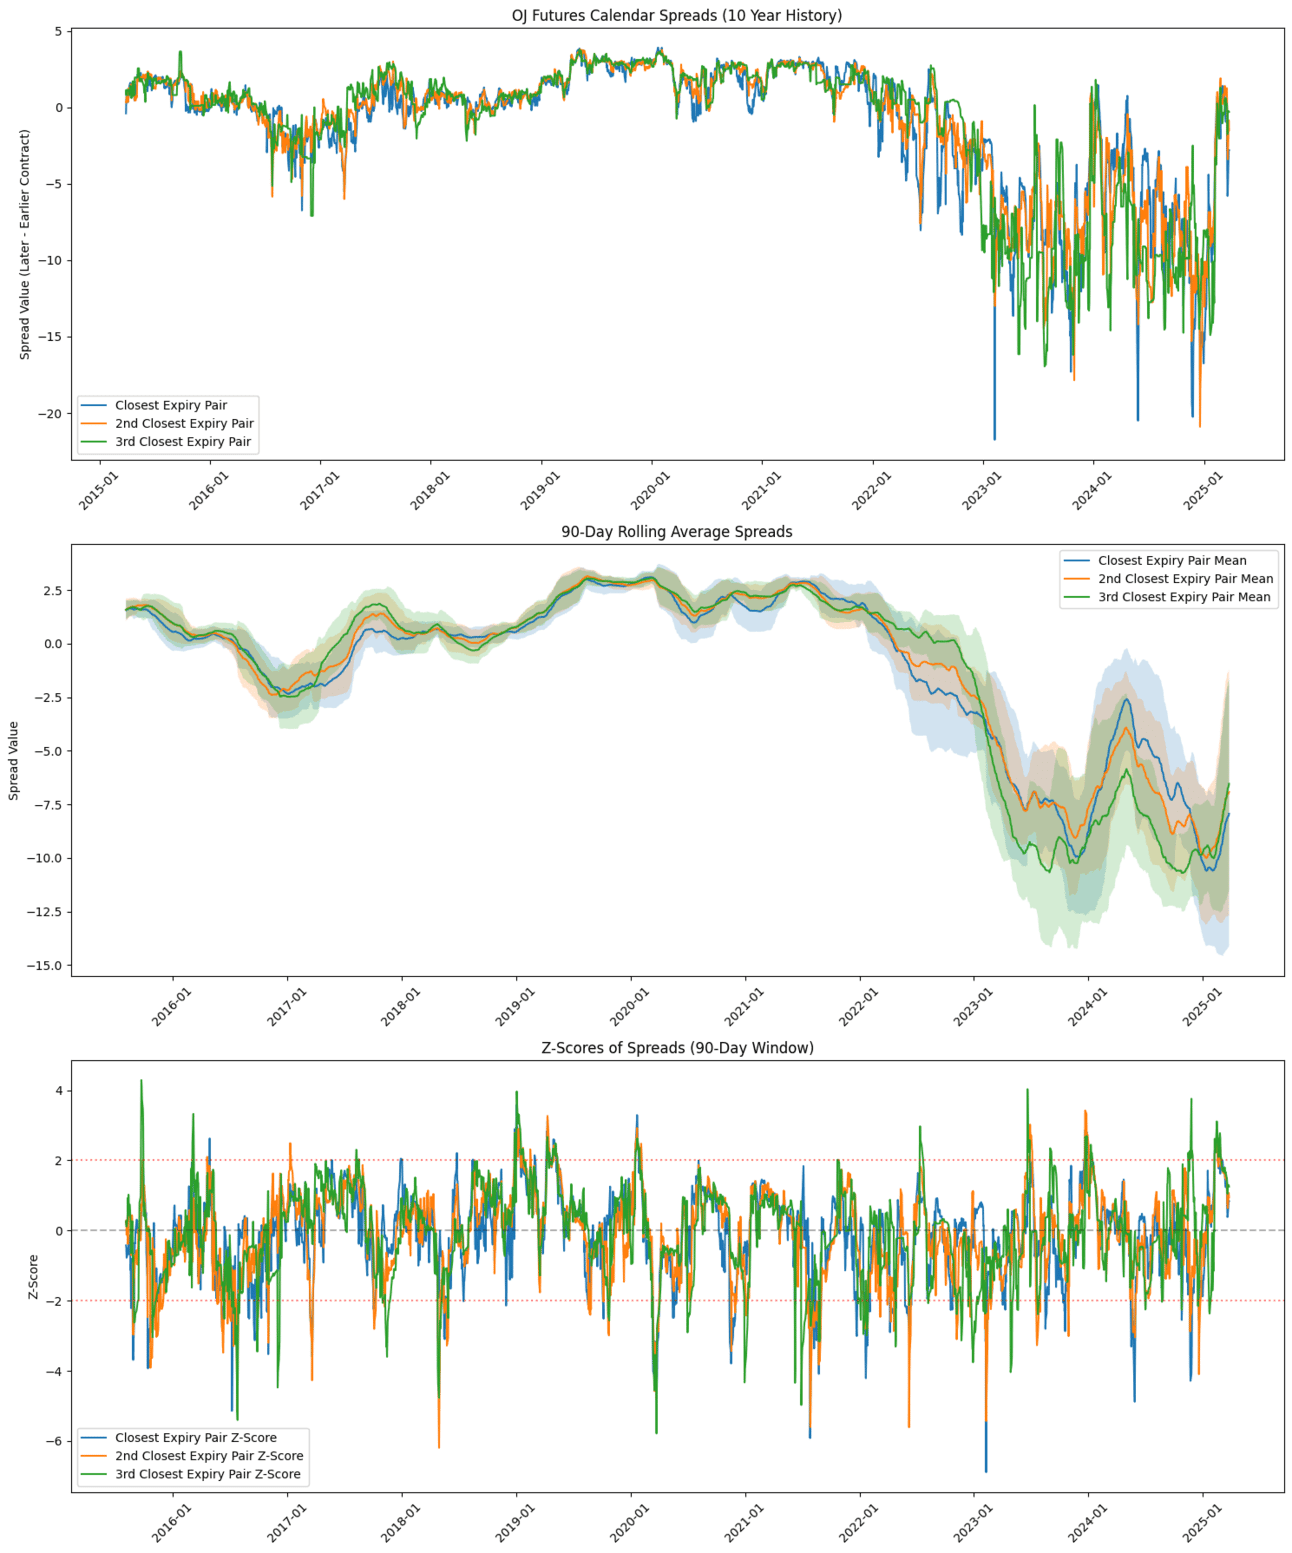
Just for the sake of a bigger picture, I have done the same analysis on 6E (Euro) and OJ (orange juice). I am hoping to get some feedback if you think I am barking up the right tree. If so, I will spend some more time building an automated strategy to backtest. It would probably involve trading a 2-Z spread spike.
S2N observations
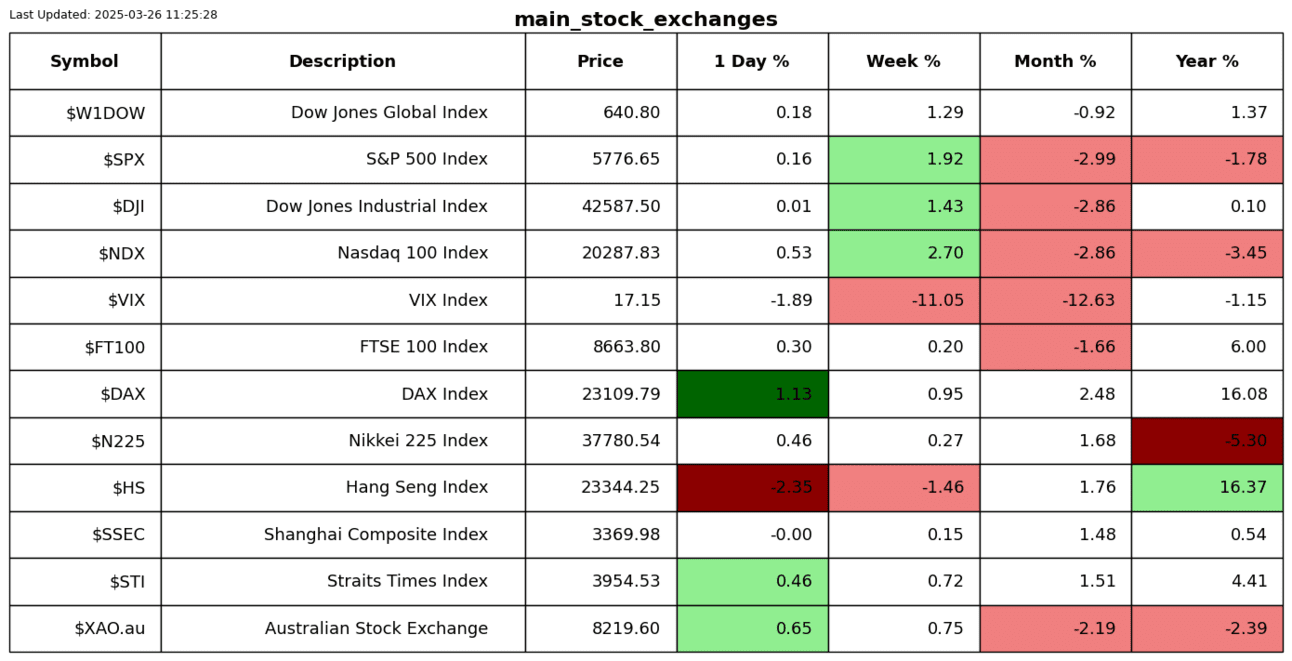
There is a new narrative doing its rounds that the era of American exceptionalism is over. I don’t buy it. I am not saying there isn’t going to be a period of subpar performance. I also stand by my longstanding profitable trade of going long China via the Hang Seng and shorting the US via the S&P 500.
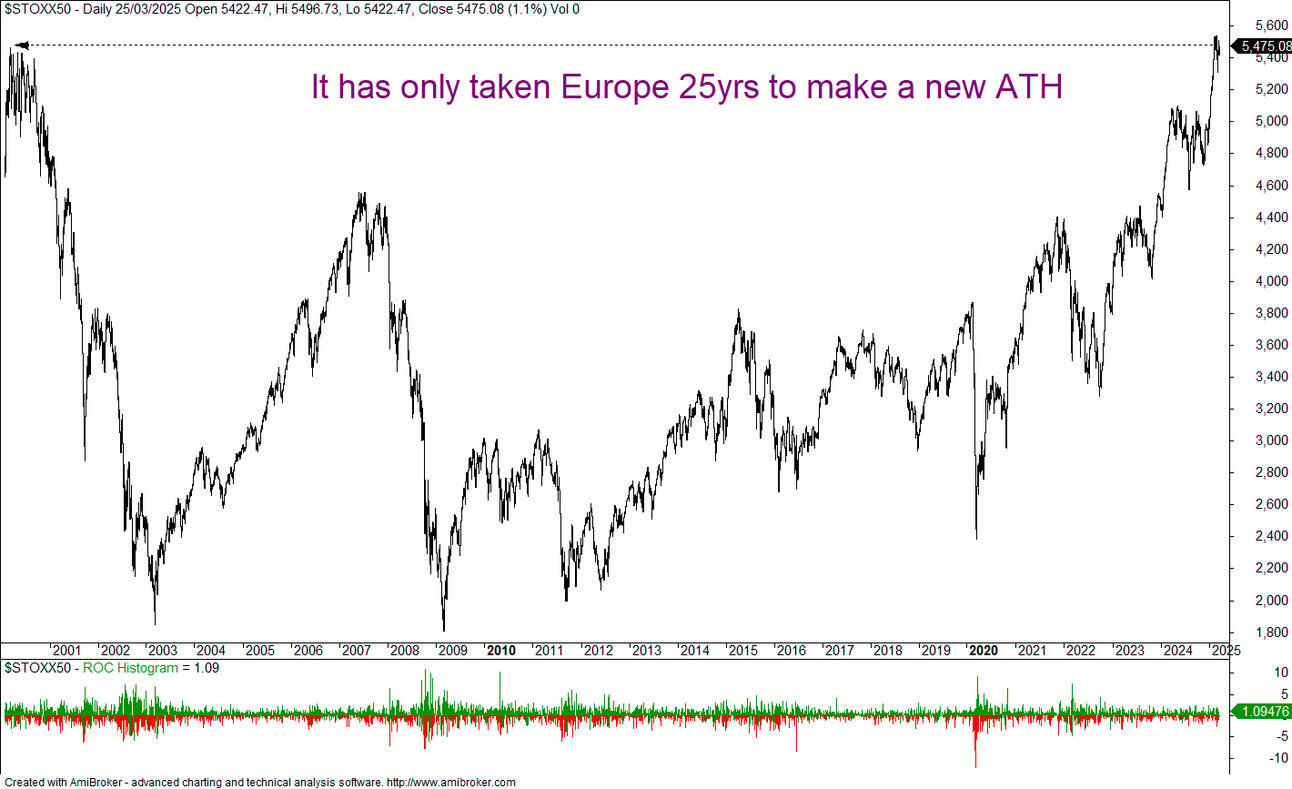
What I just don’t buy is that Europe is going to outpace the US. Europe does not have a collective culture; it is a mix of many things. I think this chart sums it up. It has taken 25 years for Europe to simply break even.
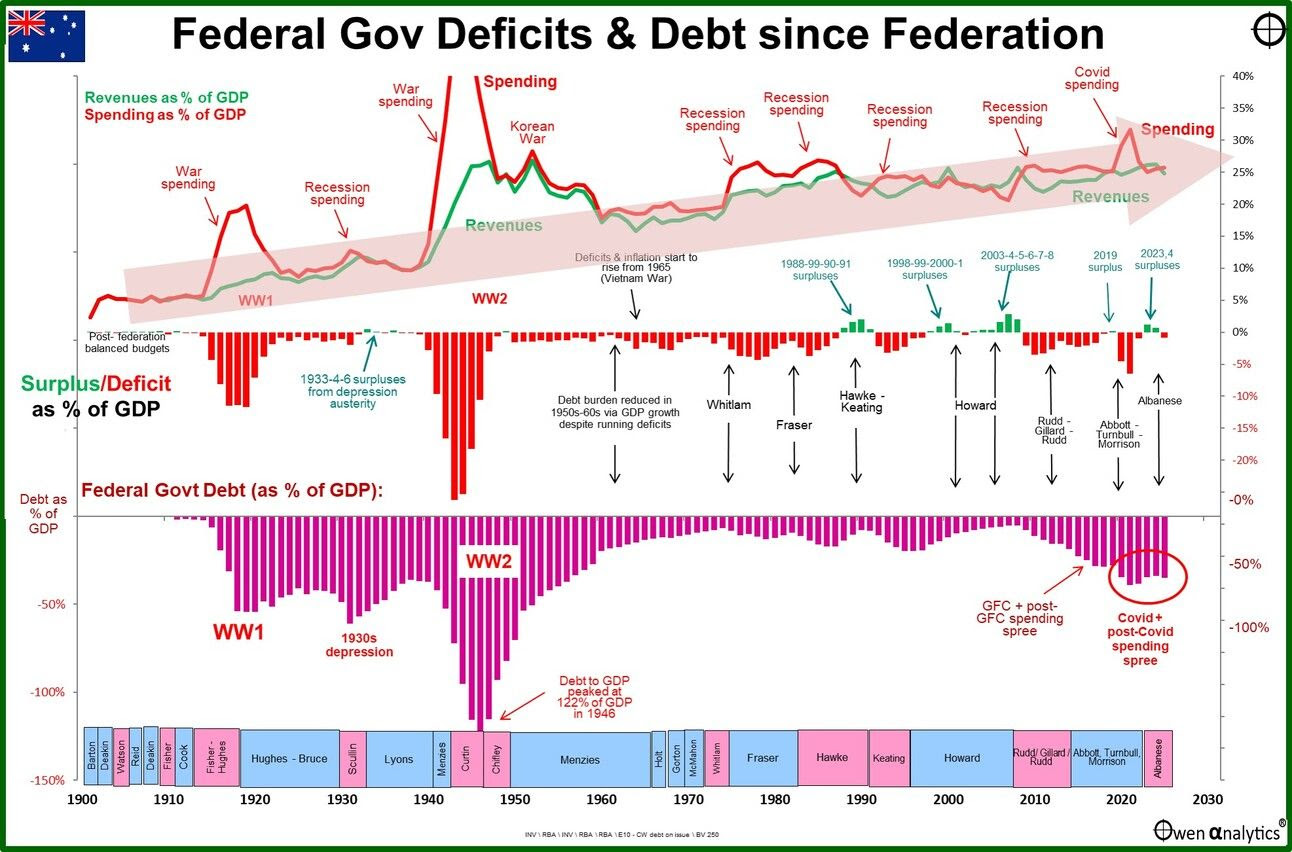
Australia’s Labour government presented its budget last night. Treasurer, Jim Chalmers, is the worst, pure snake oil spin. He makes Jordan Belfort’s Wolf of Wall Street bucket shop brokers seem respectable. Maybe I should tell you how I really feel.
Ashley Owen has done some amazing in-depth research on the subject of surplus/deficits. The budget is projected to be in deficit until 2036 (from memory).
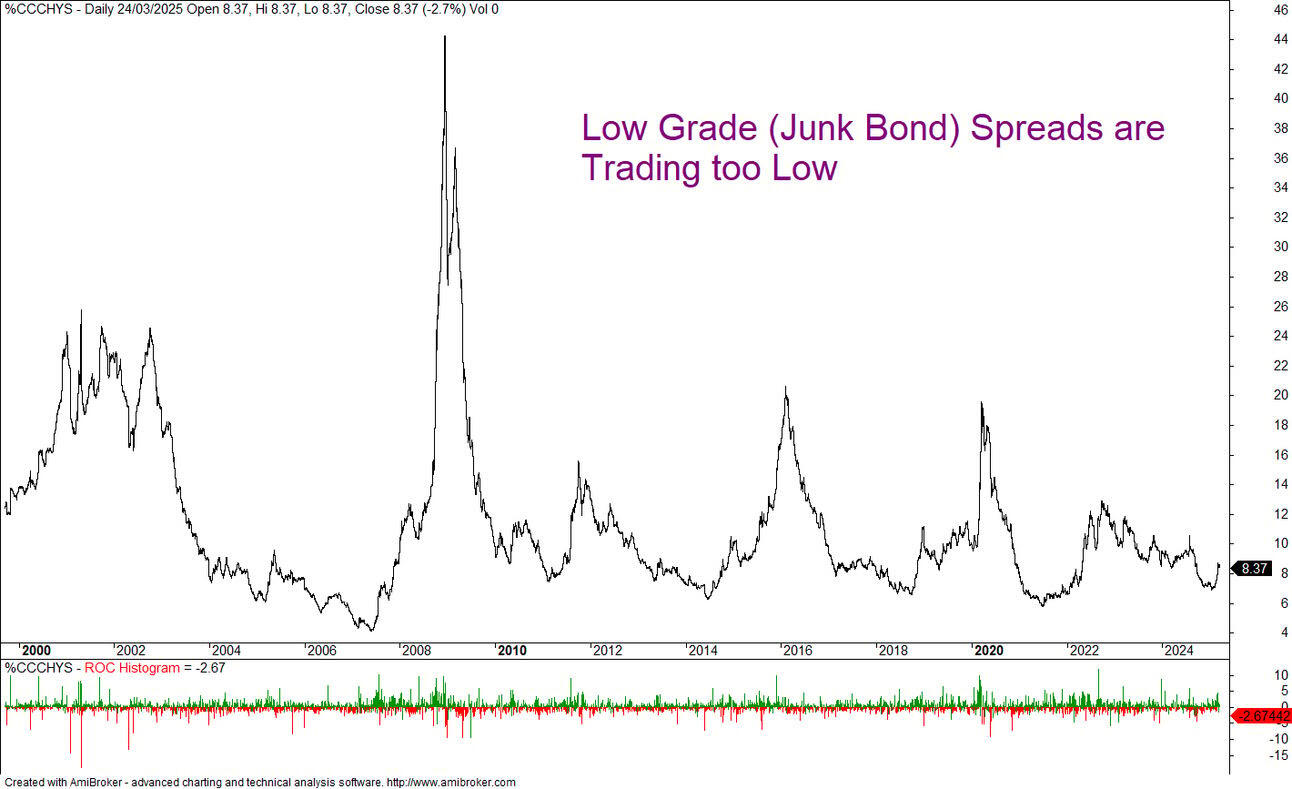
I have mentioned it before and would like to highlight it once again. Low-quality (junk) bond spreads are trading way too low. There is going to be a normalisation eventually.
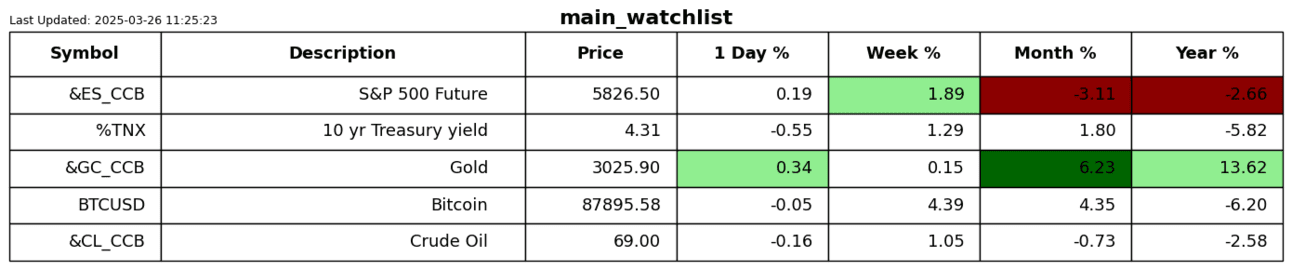
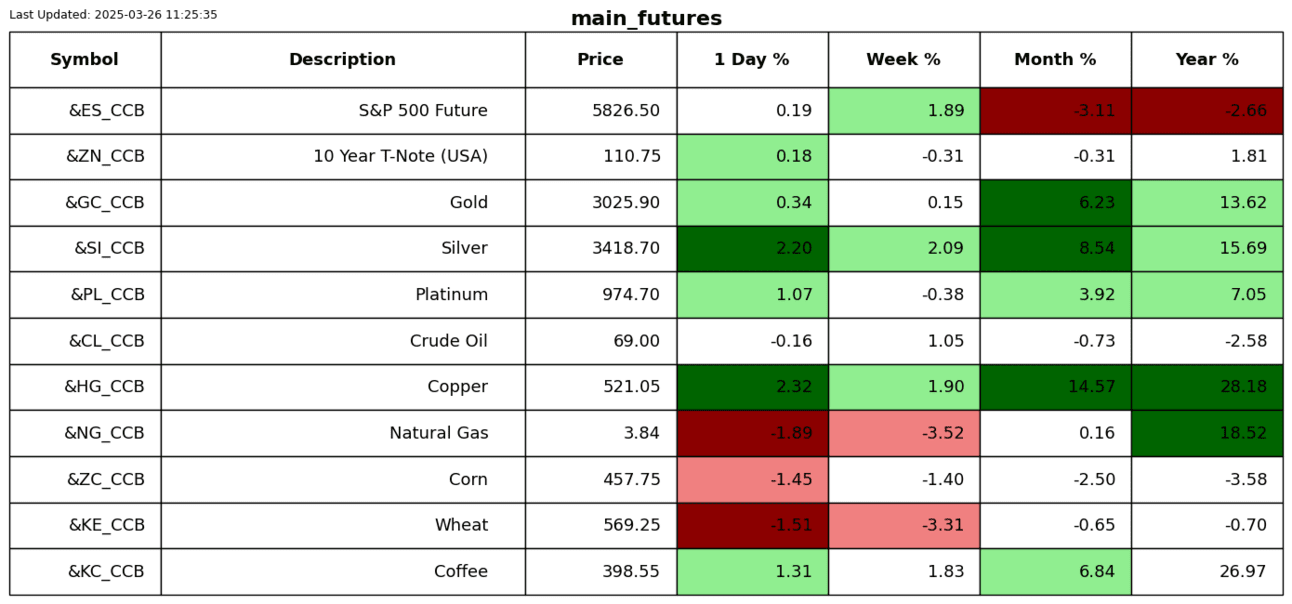
S2N screener alert
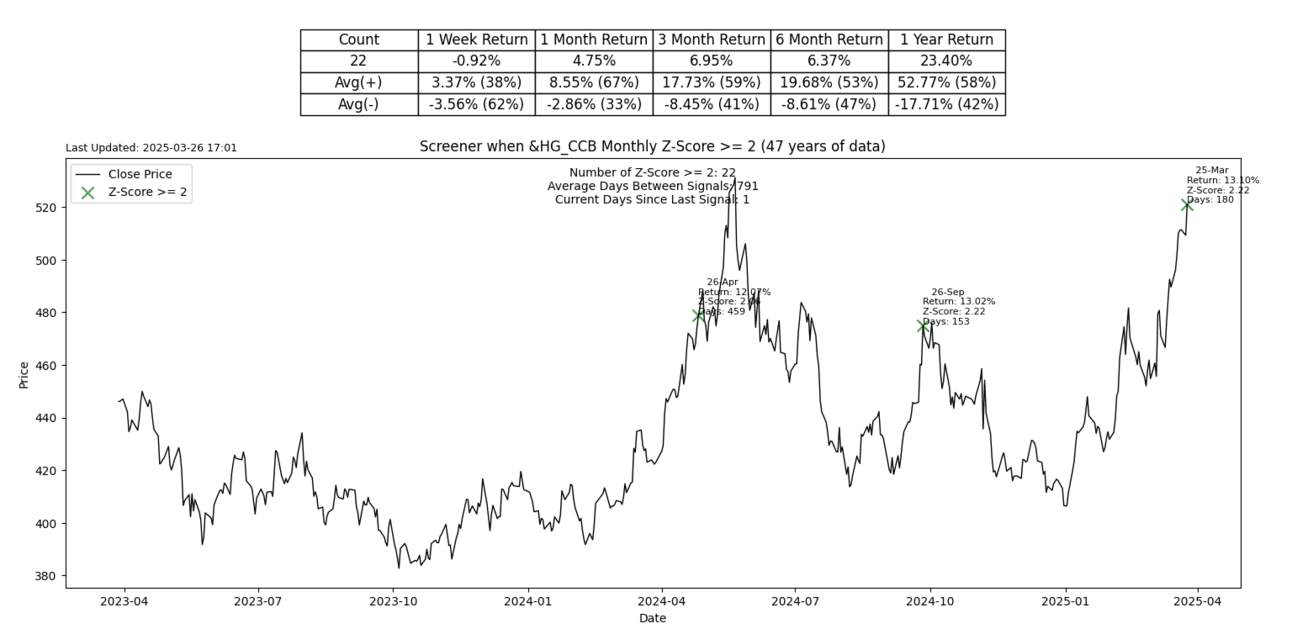
Copper is having a big month, up more than 2 sigma on the month.
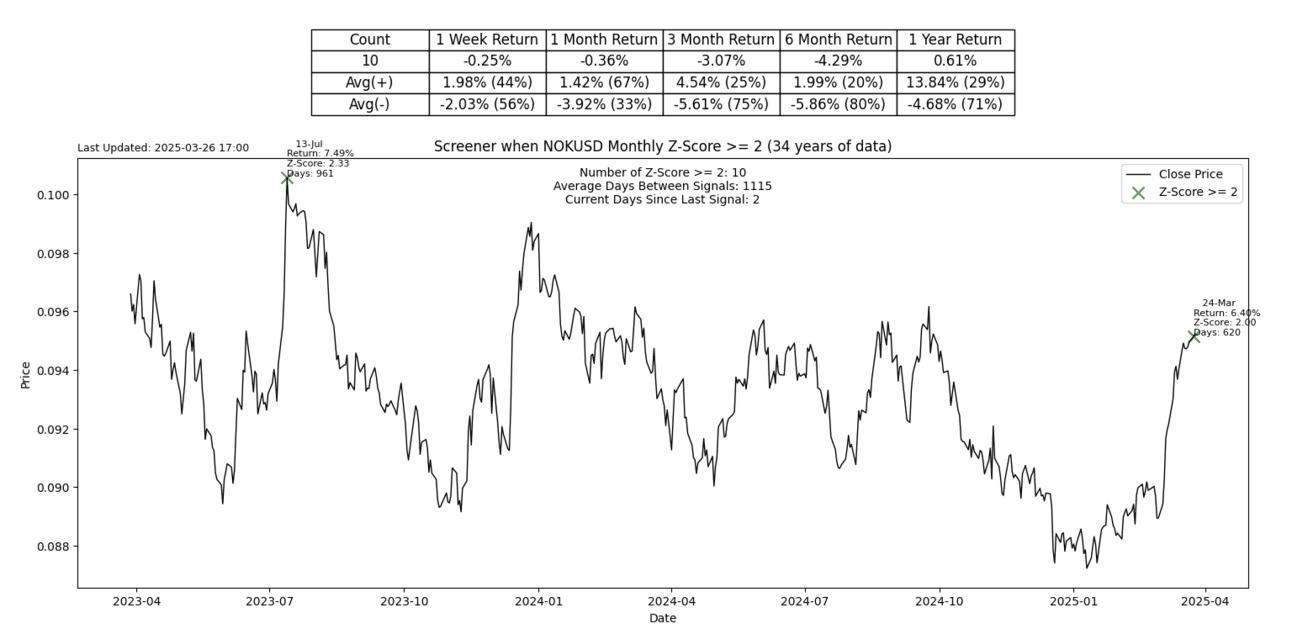
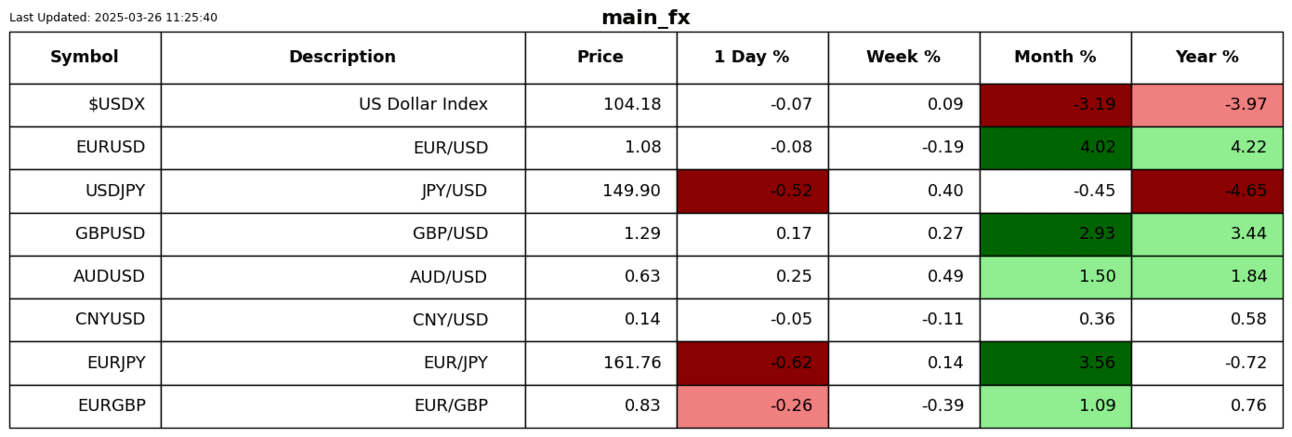
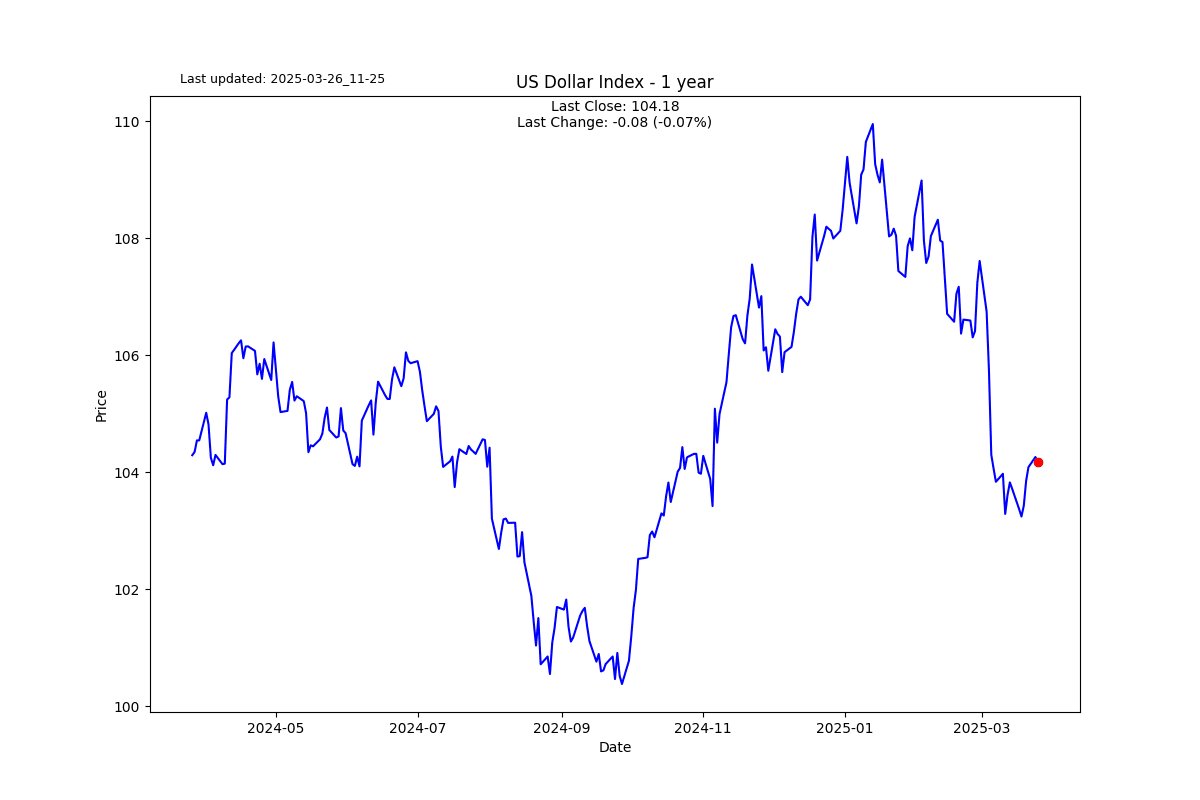
The Norwegian krone weakened a lot against the US dollar this month, 2 sigmas to be precise.
S2N performance review
S2N chart gallery
S2N news today
Author

Michael Berman, PhD
Signal2Noise (S2N) News
Michael has decades of experience as a professional trader, hedge fund manager and incubator of emerging traders.


