Gold is a highly liquid instrument with an average daily trading volume of more than US $140 billion. As gold is very liquid, traders can enjoy very tight spreads, especially during the height of the US and London trading sessions. Our gold spreads are among the best I the industry and we welcome you to compare our gold spreads to our competitors.

But to make the most of the favorable trading conditions that can be offered by gold, traders may like to utilise technical indicators to help determine the right trading strategy.

In this spirit, we have compiled a description of three technical indicators and why they are helpful for gold traders.

Relative Strength Indicator (RSI)

The RSI is a useful indicator for identifying when gold enters an overbought (above the 70 level) or an oversold (below the 30 level) condition.

Examining the RSI as it is applied to an hourly gold chart, we can see the correlation between the peaks in the RSI and the local peaks in the price of gold. After the RSI climbed above the 70 level (or got very close to doing so), the price of gold empathically fell in price.

RSI is great for confirming a trade decision with gold. If you find an entry for buy position, you can check the RSI value for confirmation. If the RSI is above the 70 level, you may want to reconsider this buy trade, as gold is in overbought territory. A value below 70 would be preferable. 

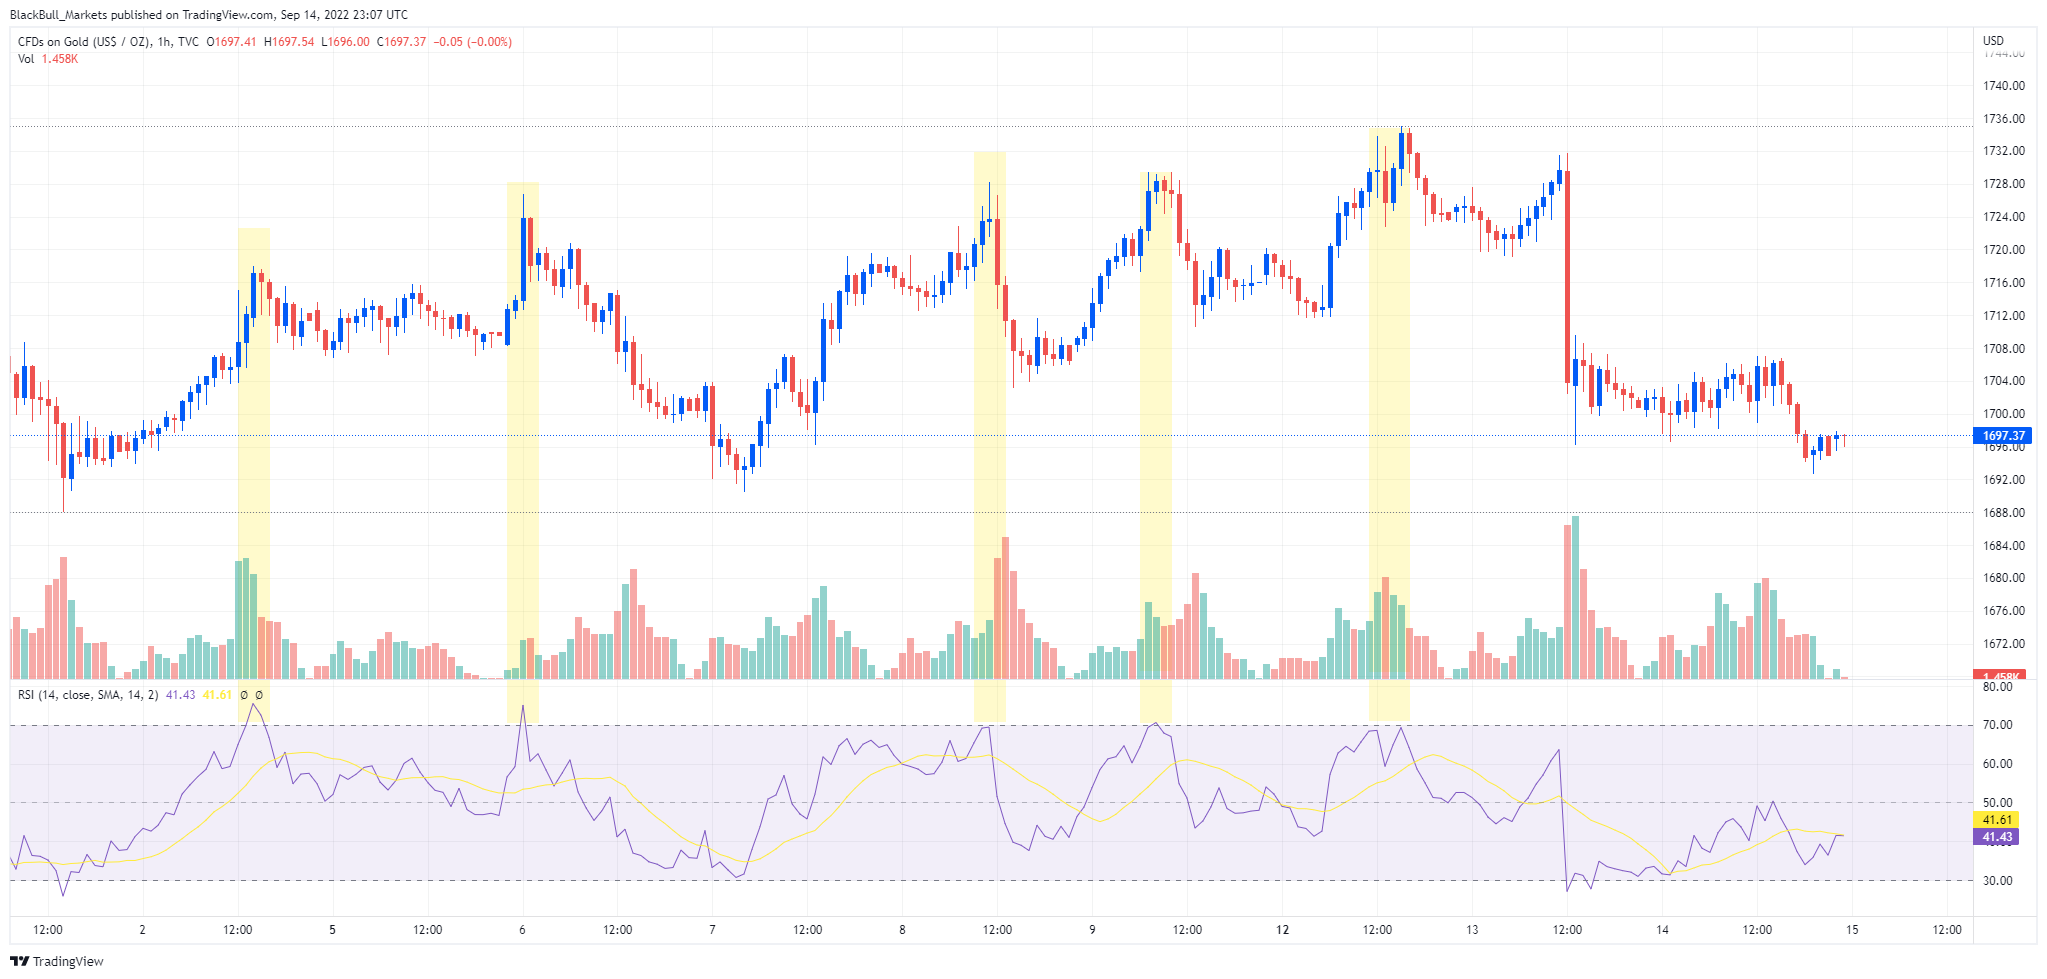
XAU/USD 1H, with RSI

Moving Averages (MA)

Moving averages are effective indicators that can help gold traders by helping them gauge the direction of the market.

You have two main choices when it comes to moving averages: Exponential (EMA) and Simple (SMA). It is good to note that the EMA gives greater weight to the most recent prices, while the SMA weighs all inputs equally.

The best moving average to use with gold trading depends on your strategy and preferences, and particularly the time frame on which you are viewing the charts.

On the one-hour chart below there are 3 SMAs based on a small-time frame so that the direction of the market can be accurately depicted. The moving averages below are based on the previous 5, 8 and 13 candles. As we are on a very small time frame, the difference between the EMA and SMA lines are reduced.

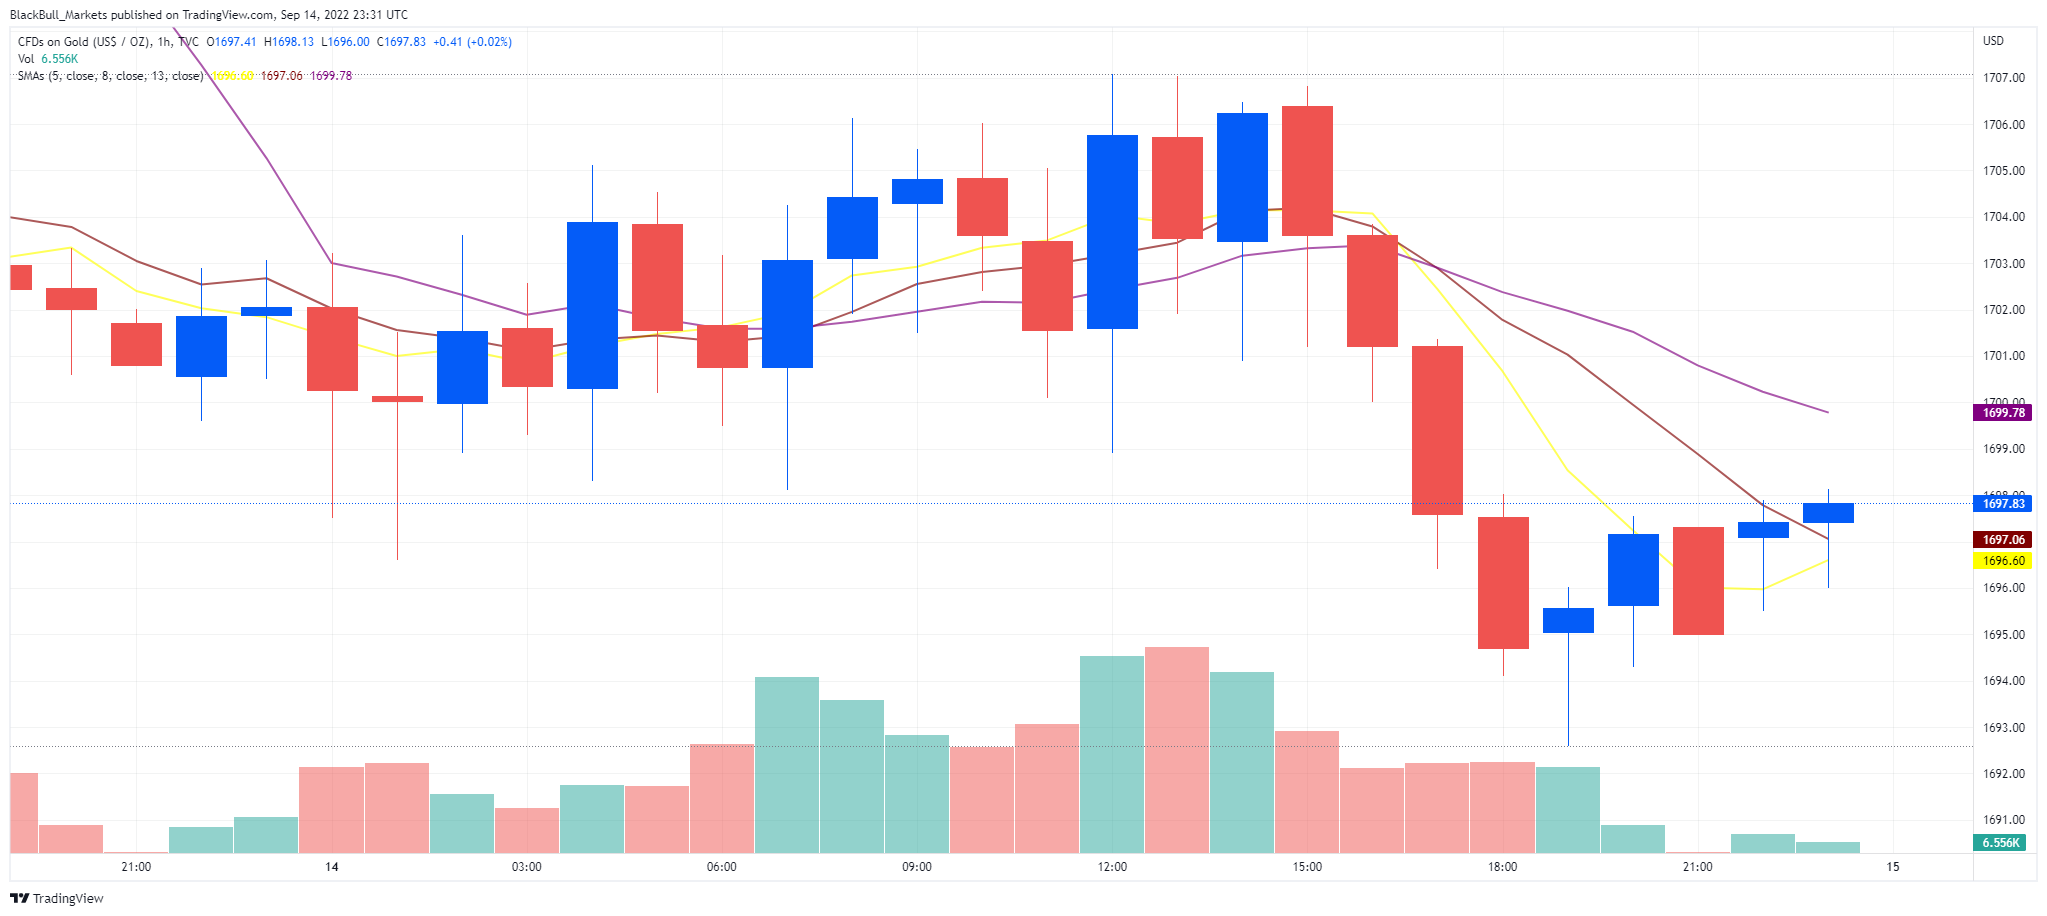
XAU/USD 1H, with 5,8, and 13-candle SMA

Bollinger Bands

The Bollinger Bands indicator is useful for visualizing volatility and the range that gold has recently traded.

The most helpful quality of the Bollinger Bands is that the two outer lines show where price movement should be expected to trade 90% of the time (the trading band). As such, when trading gold, the outer lines can help you determine levels for placing your stop loss and take profit. Traders will typically open or close gold trades when gold price hits one of the outer Bollinger Bands.


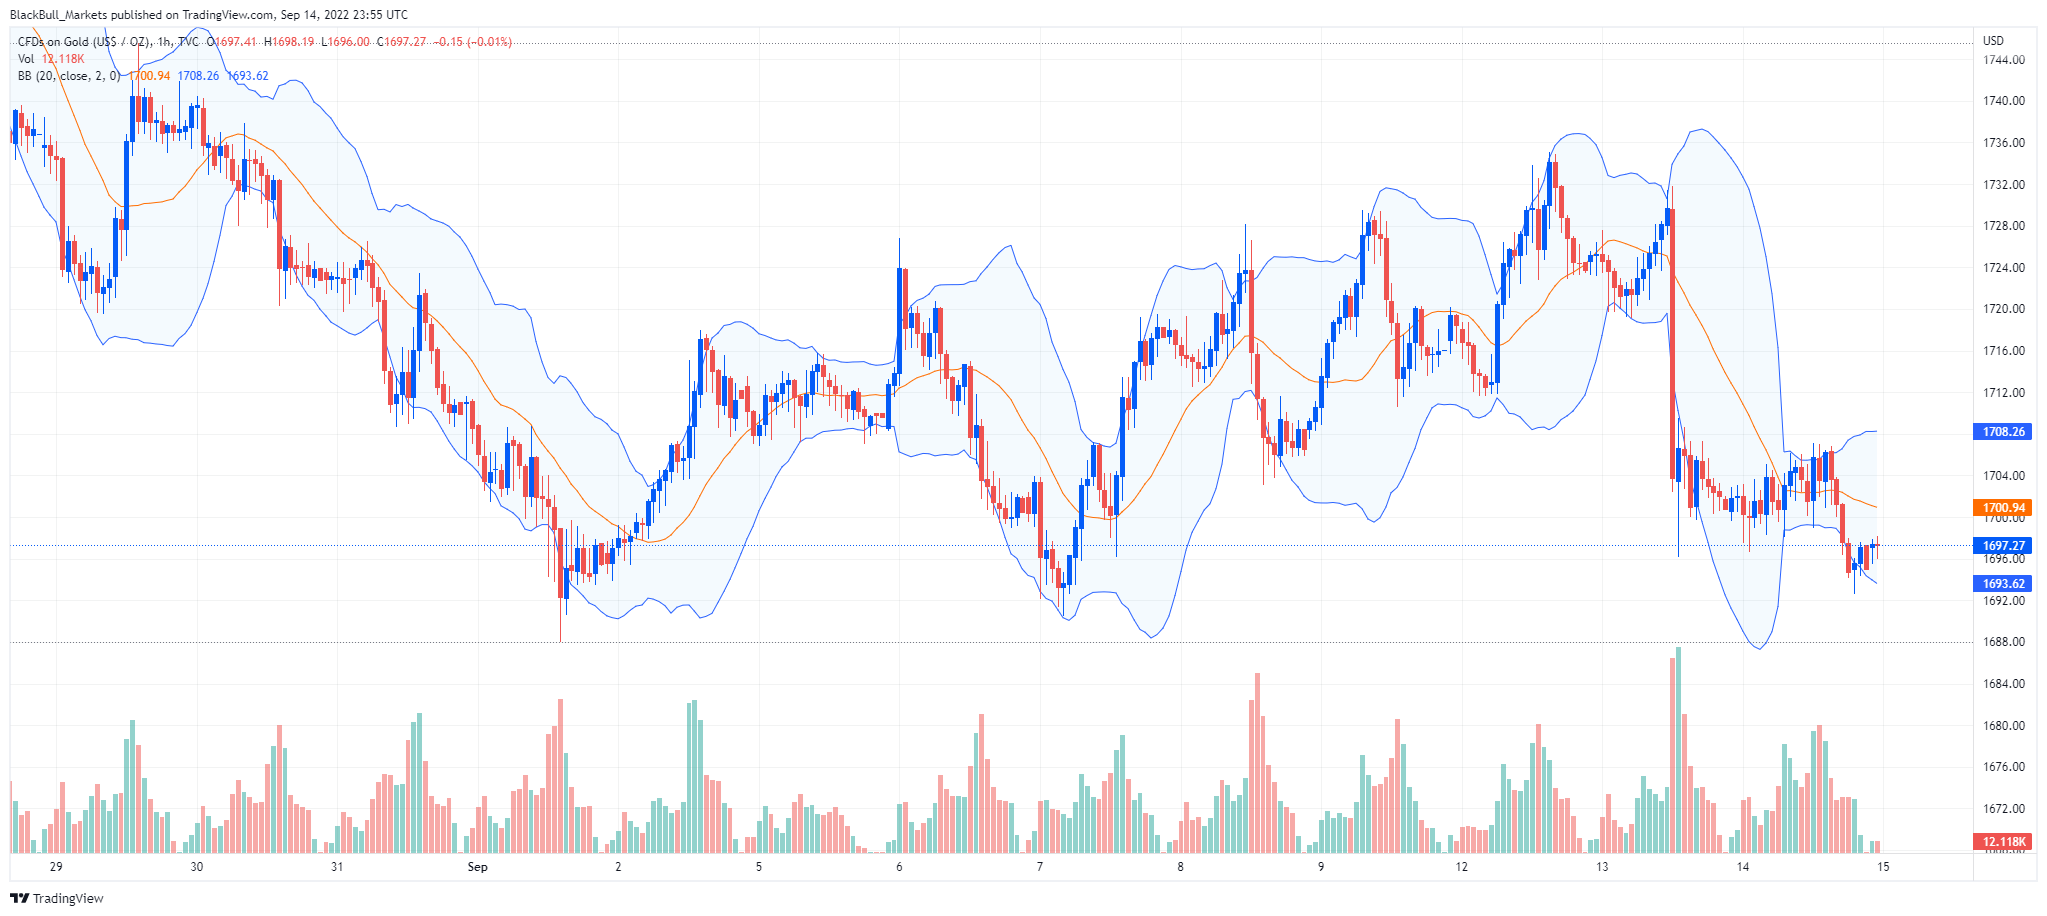
XAU/USD 1H, with Bollinger Bands Indicator

Risk Warning: Trading foreign exchange on margin carries a high level of risk and may not be suitable for all investors. The high degree of leverage can work against you as well as for you. Before deciding to trade foreign exchange, you should carefully consider your investment objectives, level of experience, and risk appetite. The possibility exists that you could sustain a loss of some or all of your initial investment and, therefore, you should not invest money you cannot afford to lose. You should make yourself aware of all the risks associated with foreign exchange trading and seek advice from an independent financial adviser if you have any questions or concerns as to how a loss would affect your lifestyle.

Recommended Content


Recommended Content

Editors’ Picks

AUD/USD consolidates near 19-month peak as traders await US PCE Price Index

AUD/USD consolidates near 19-month peak as traders await US PCE Price Index

AUD/USD oscillates in a range below the 0.6900 mark, as traders opt to move to the sidelines ahead of the US PCE Price Index. In the meantime, the RBA's hawkish stance, the optimism led by additional monetary stimulus from China, the prevalent risk-on mood, and a bearish USD continue to act as a tailwind for the pair.

AUD/USD News
USD/JPY holds above 145.00 after the Tokyo CPI inflation data

USD/JPY holds above 145.00 after the Tokyo CPI inflation data

The USD/JPY pair attracts some buyers to near 145.20 on Friday during the early Asian session. The pair gains ground near three-week highs after the Tokyo Consumer Price Index. The attention will shift to the US Personal Consumption Expenditures Price Index for August, which is due later on Friday. 

USD/JPY News
Gold price holds steady near record peak; looks to US PCE data from fresh impetus

Gold price holds steady near record peak; looks to US PCE data from fresh impetus

Gold price consolidates below the all-time high set on Thursday amid overbought conditions on the daily chart and the risk-on mood, though dovish Fed expectations continue to act as a tailwind. Bulls, meanwhile, prefer to wait for the release of the US PCE Price Index before placing fresh bets. 

Gold News
Ethereum investors show bullish bias amid ETF inflows and positive funding rates, exchange reserves pose risk

Ethereum investors show bullish bias amid ETF inflows and positive funding rates, exchange reserves pose risk

Ethereum traded around $2,640 on Thursday, up more than 2% following increased bullish bias among investors, as evidenced by ETH ETF net inflows and an uptrend in funding rates. However, investors may be wary of a potential correction from ETH's rising exchange reserve.

Read more
RBA widely expected to keep key interest rate unchanged amid persisting price pressures

RBA widely expected to keep key interest rate unchanged amid persisting price pressures

The Reserve Bank of Australia is likely to continue bucking the trend adopted by major central banks of the dovish policy pivot, opting to maintain the policy for the seventh consecutive meeting on Tuesday.

Read more
Five best Forex brokers in 2024

Five best Forex brokers in 2024

VERIFIED Choosing the best Forex broker in 2024 requires careful consideration of certain essential factors. With the wide array of options available, it is crucial to find a broker that aligns with your trading style, experience level, and financial goals. 

Read More

Majors

Cryptocurrencies

Signatures