Two-year vs FedFunds signal
What will happen to markets in case Feb CPI rises well over expectations? What would happen if it inflation undershot expectations of 6.0% y/y and 0.4% m/m ? The SVB implosion has eliminated odds of a 50-bp Fed hike, boosting metals and non-USD FX. Even odds of a 25-bp hike (not 50bp) are now below 60%. The chart on the left shows the straightforward relationship between odds of a 25-bp hike and gold, with the odds plotted on an inverted scale. But let's dig deep on the right-hand chart, plotting the FedFunds rate against the 2-year yield/FedFunds spread.
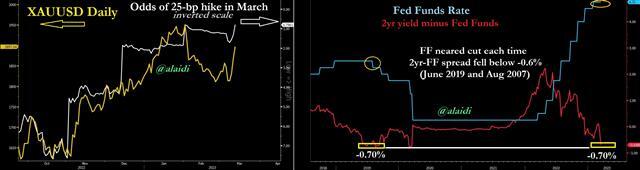
In a matter of 4 days, US 2-year yields have gone from hitting 16-year highs to posting the biggest drop in 40 years. The 4.09% print is 0.66 below the Fed Funds rate—a level at which the Fed Funds rate had peaked shortly before the Fed began cutting rates. This is highlighted in the chart as Aug 2007 and June 2019.
What's the rationale for this development? In absolute terms (not relative to other tenors), the short-end of the curve is always the last to begin pricing the end of rate hikes or rate cuts. So when 10-year yields fell below their 2-year and 3-month counterparts last autumn, the yield curve entered inversion as the longer-end began pricing slowdown/end of hikes. During that time, however, both 2-year and 3-month yields (t-bills) were on the rise. And as we know, 2-yr yields hit a 15-year high early last week. So just a reminder: Yield curve inversions usually precede rate cuts by 1-2 years, while re-steepening of the curve (when short-term yields start to fall towards longer-term yields) is usually a more accurate indicator of timing of the cuts as it is closer to it materialising.
Finally this week, both 2-year and 3-month yields registered a sharp decline, in response to deep repricing of Fed hike expectations following the collapse of SVB. The rise in US unemployment and slowdown in average hourly earnings in Friday's jobs report (full analysis here) did help to weigh on yields, USD and boost metals. When it rains, it pours -- “Risk happens fast” as the market saying goes.
If Tuesday's release of the Feb CPI comes in at or below 6.0%, then gold could easily regain $1960. This also depends on what the m/m reading does. There are various permutations from the CPI release, paving the way for a $30-40 jump in gold. What if CPI rises above 6.5% y/y? I would say stocks will generally bear the worst of such outcome, with a possible bounce in yields but eventual rally in gold following an initial selloff.
Meanwhile, our WhatsApp Broadcast Group does not waste time. 5-7 seconds after the CPI release, members will get a voice note with my immediate assessment of the whole CPI report, focusing on what it means for gold/indices/FX, later followed by text messages, trades and charts. Good luck.
Author

FXStreet Team
FXStreet


