12K jobs and the markets up?

USD: Dec '24 is Down at 103.550.
Energies: Dec '24 Crude is Up at 71.57.
Financials: The Dec '24 30 Year T-Bond is Up 37 ticks and trading at 117.31.
Indices: The Dec '24 S&P 500 emini ES contract is 4 ticks Lower and trading at 5757.25.
Gold: The Dec'24 Gold contract is trading Up at 2749.50.
Initial conclusion
This is not a correlated market. The USD is Down and Crude is Up which is normal, but the 30 Year T-Bond is trading Higher. The Financials should always correlate with the US dollar such that if the dollar is Higher, then the bonds should follow and vice-versa. The S&P is Lower and Crude is trading Higher which is correlated. Gold is trading Higher which is correlated with the US dollar trading Down. I tend to believe that Gold has an inverse relationship with the US Dollar as when the US Dollar is down, Gold tends to rise in value and vice-versa. Think of it as a seesaw, when one is up the other should be down. I point this out to you to make you aware that when we don't have a correlated market, it means something is wrong. As traders you need to be aware of this and proceed with your eyes wide open. Asia traded mainly Higher with the exception of the Nikkei and Sensex exchanges. All of Europe is trading mainly Higher except the German Dax.
Possible challenges to traders
-
Factory Orders are out at 10 AM EST. This is Major.
-
Loan Officer Survey - Tentative. This is Major.
Traders, please note that we've changed the Bond instrument from the 10 year (ZN) to the 2 year (ZT). They work exactly the same.
We've elected to switch gears a bit and show correlation between the 2-year Treasury notes (ZT) and the S&P futures contract. The YM contract is the Dow Jones Industrial Average, and the purpose is to show reverse correlation between the two instruments. Remember it's likened to a seesaw, when up goes up the other should go down and vice versa.
On Friday the ZT dropped Lower at around 8:30 AM EST as soon as the Jobs numbers were released. The Dow climber Higher at the same time. Look at the charts below and you'll see a pattern for both assets. The Dow moved Higher at 8:30 AM and the ZT moved Lower at around the same time. These charts represent the newest version of Bar Charts, and I've changed the timeframe to a 15-minute chart to display better. This represented a Short opportunity on the 2-year note, as a trader you could have netted about 50 plus ticks per contract on this trade. Each tick is worth $7.625. Please note: the front month for ZT is Dec and the Dow is now Dec '24. I've changed the format to filled Candlesticks (not hollow) such that it may be more apparent and visible.
Charts courtesy of barcharts
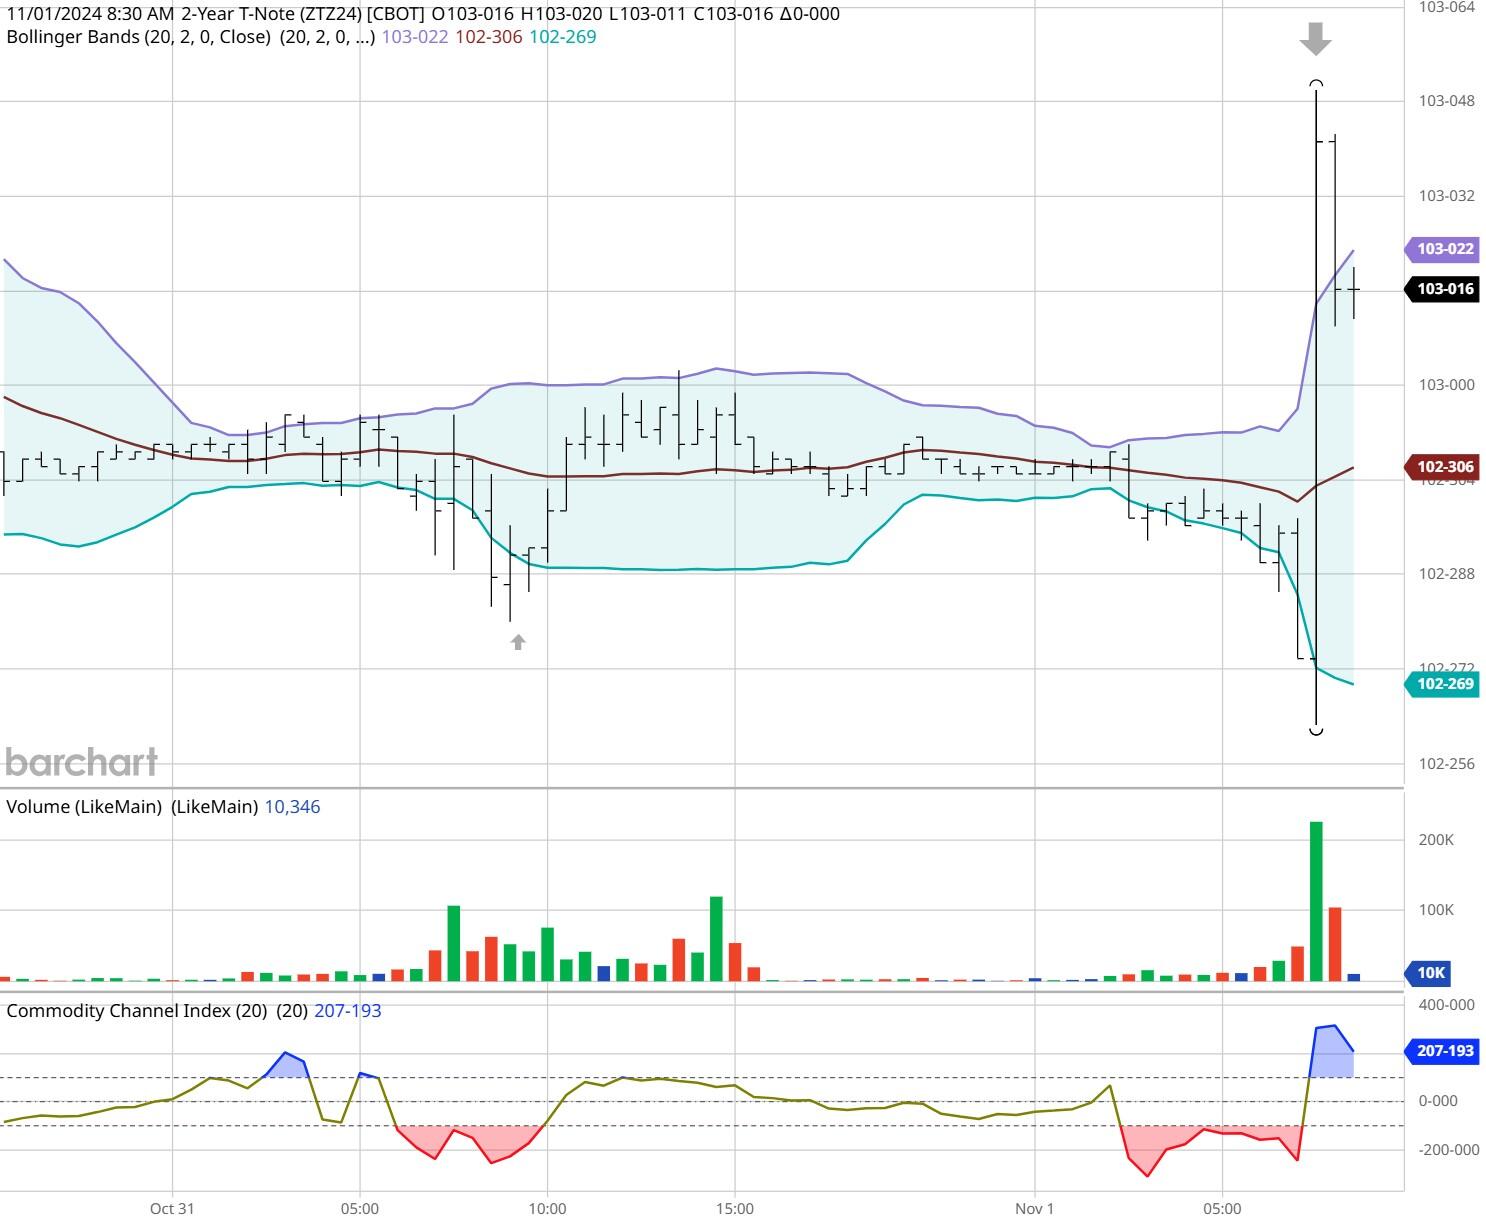
ZT -Dec 2024 - 11/01/24
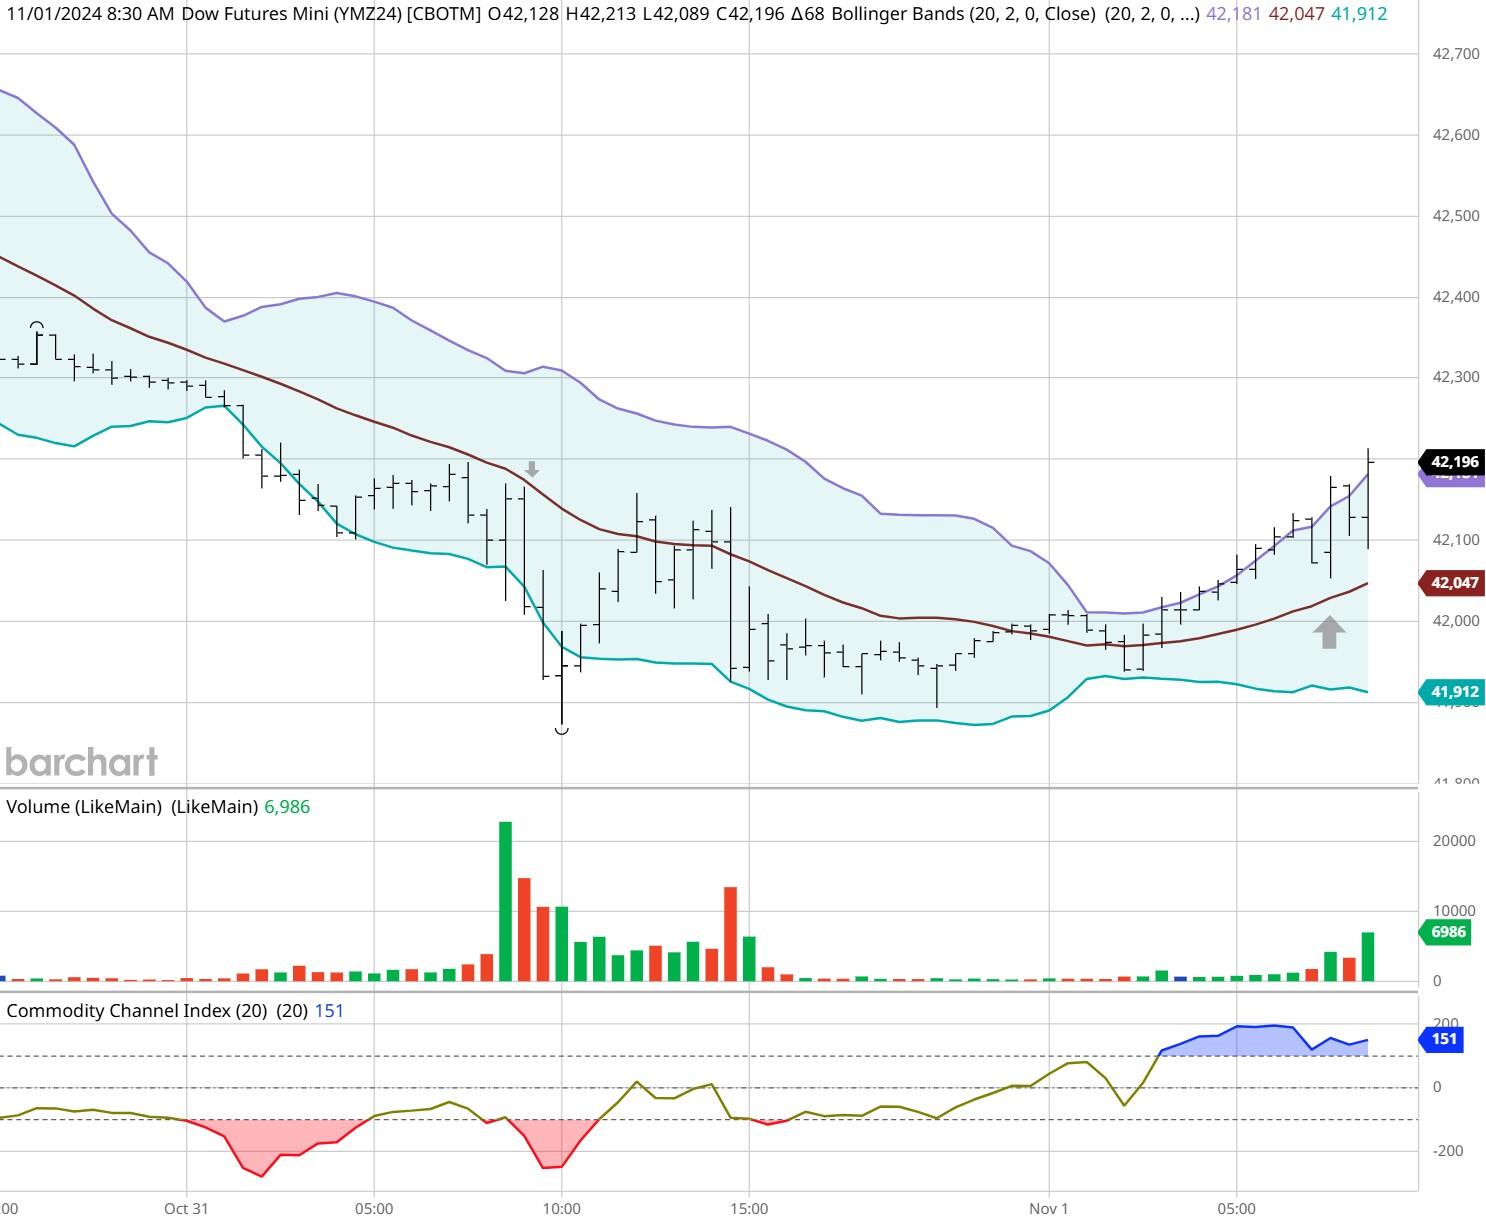
Dow - Dec 2024- 11/01/24
Bias
On Friday we gave the markets a Neutral bias as it was Jobs Friday, and we always maintain a Neutral or Mixed on the that day. Why? Because the markets have never shown any sense of normalcy on that day and Friday was no exception. The Dow closed 289 points Higher, and the other indices closed Higher as well. Today we aren't dealing with a correlated market, and our bias is to the Downside.
Could this change? Of Course. Remember anything can happen in a volatile market.
Commentary
So, the Job numbers was released on Friday, and it only showed a gain of 12,000 jobs in September. According to the White House this was a "fluke". Someone needs to tell Boy Scout Joe that no one wants to hire this close to a Presidential Election. This being said teh markets showed a gain on Friday, how could that be? The reason is with the perception that a weak jobs report will dissuade the Federal Reserve from raising interest rates; either because they think the market is weaker or because this will end the notion an overheated economy which has been the main complaint of the Federal Reserve for some time now. Will this continue? Only time will tell.
Author

Nick Mastrandrea
Market Tea Leaves


