|

USD/INR technical analysis: 4H 100MA, 23.6% Fibo. limit immediate upside

  • The USD/INR pair’s recovery from 68.25 falls short of clearing near-term key resistances, indicating momentum weakness.
  • 9-week old descending trend-line can question buyers past-68.91.

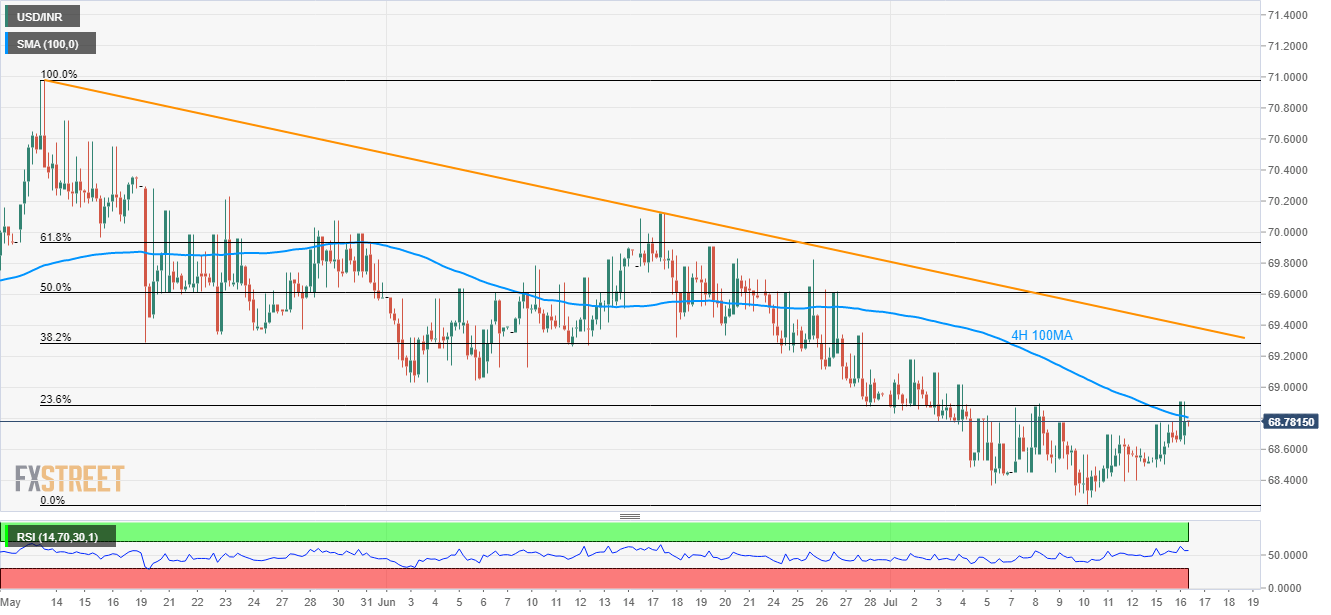
Unless breaking 100-bar moving average on the 4-hour chart (4H 100MA) and 23.6% Fibonacci retracement of May-July downpour, USD/INR pullback remains less significant as it trades near 68.77 heading into the European open on Wednesday.

Even if the pair manage to clear 68.80 and 68.91 levels, carrying aforementioned indicators, a 9-week old descending resistance-line stretched since mid-May around 69.40 could challenge buyers.

Though, pair’s rise past-69.40 enables it to aim for 70.00 psychological magnet.

On the flip side, 68.45 can act as close support before the latest low surrounding 68.25 regains market attention.

Also, pair’s sustained declines below 68.25 open the gate for fresh south-run to late-June 2018 bottom at 67.6850.

USD/INR 4-hour chart

fxsoriginal

Trend: Pullback expected

Additional important levels

Overview
Today last price68.7855
Today Daily Change0.1115
Today Daily Change %0.16%
Today daily open68.674
 
Trends
Daily SMA2068.8992
Daily SMA5069.3894
Daily SMA10069.4559
Daily SMA20070.4722
Levels
Previous Daily High68.78
Previous Daily Low68.481
Previous Weekly High68.8975
Previous Weekly Low68.2475
Previous Monthly High70.1225
Previous Monthly Low68.8755
Daily Fibonacci 38.2%68.6658
Daily Fibonacci 61.8%68.5952
Daily Pivot Point S168.51
Daily Pivot Point S268.346
Daily Pivot Point S368.211
Daily Pivot Point R168.809
Daily Pivot Point R268.944
Daily Pivot Point R369.108

Author

Anil Panchal

Anil Panchal

FXStreet

Anil Panchal has nearly 15 years of experience in tracking financial markets. With a keen interest in macroeconomics, Anil aptly tracks global news/updates and stays well-informed about the global financial moves and their implications.

More from Anil Panchal
Share:

Editor's Picks

EUR/USD seems fragile below 1.1700 as Middle East war boosts energy prices

The EUR/USD pair trades flat at around 1.1680 during the Asian trading session on Tuesday, but broadly seems vulnerable, being close to its five-week low. The major currency pair is under pressure as surging oil prices due to the United States-Israel war with Iran have increased the risks of higher inflation for the Old Continent.

GBP/USD hovers around 1.3400 with bearish pressure intact

GBP/USD edges higher after three days of losses, trading around 1.3400 during the Asian hours on Tuesday. The technical analysis of the daily chart indicates an ongoing bearish bias, as the pair trades within a descending channel pattern.

Gold sticks to gains above $5,350 amid sustained safe-haven demand; firmer USD caps gains

Gold sticks to its positive bias for the third straight day and trades above the $5,350 level heading into the European session on Tuesday. Concerns about a broader regional conflict in the Middle East continue to weigh on investors' sentiment and underpin demand for the traditional safe-haven bullion.

Stellar risks deeper losses as derivatives metrics turn negative

Stellar is trading red below $0.16 at the time of writing on Tuesday, after a slight recovery the previous day. Weakening derivatives data caps the recovery, while an unfavorable technical outlook projects a deeper correction for the XLM token in the upcoming days.

The market is not panicking it is repricing the probability distribution of Oil and time

At the end of the day, markets do not trade morality or geopolitics. They trade transmission channels. And the only channel that truly matters in this maelstrom runs through the price of energy and the time value of money.

Hyperliquid Price Forecast: HYPE rises on commodities demand amid US-Iran war

Hyperliquid (HYPE) steadies above $33 at press time on Tuesday, marking its fourth consecutive day of recovery in a broadly volatile market due to the ongoing US-Israel strikes on Iran.