USD/INR Price Analysis: Indian Rupee drops towards 82.50 support confluence


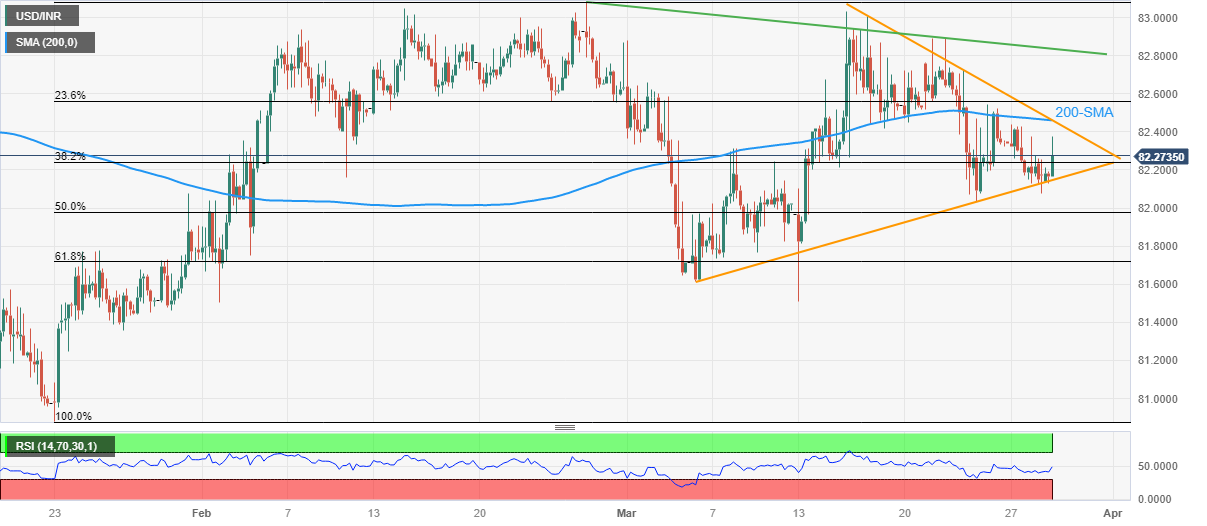
  • USD/INR extends bounce off three-week-old support line towards short-term key resistance.
  • 200-SMA, fortnight-long descending trend line challenges Indian Rupee bears.
  • Steady RSI suggests further grinding of prices inside triangle formation.

USD/INR picks up bids to pare weekly losses around 82.30 as it snaps a two-day downtrend amid early Wednesday. In doing so, the Indian Rupee pair rebounds from an ascending support line from March 06, and stays within the short-term symmetrical triangle.

It’s worth noting, however, that the steady RSI (14) line hints at the USD/INR pair’s further dribbling inside the stated triangle, currently between 82.15 and 82.50.

That said, the 200-SMA adds strength to the triangle’s top line surrounding 82.50, making it a tough nut to crack for the USD/INR bulls.

In a case where USD/INR price rallies beyond 82.50, a one-month-old descending resistance line near 82.85 can challenge the pair buyers before directing them to the multiple resistance area surrounding the 83.00 psychological magnet.

On the flip side, a clear break of the 82.15 level can quickly drag the USD/INR bears towards the 61.8% Fibonacci retracement level of the pair’s late January-February upside, near 81.70.

During the fall, the 82.00 round figure may act as an intermediate halt while the monthly low of near 81.50 acts as an extra filter towards the south.

Overall, USD/INR is likely to remain sidelined but the multiple hurdles toward the north keep the pair sellers hopeful.

USD/INR: Four-hour chart

Trend: Limited upside expected

Additional important levels

Overview
Today last price 82.2604
Today Daily Change 0.0837
Today Daily Change % 0.10%
Today daily open 82.1767
 
Trends
Daily SMA20 82.2851
Daily SMA50 82.2555
Daily SMA100 82.1349
Daily SMA200 81.2584
 
Levels
Previous Daily High 82.378
Previous Daily Low 82.079
Previous Weekly High 82.8926
Previous Weekly Low 82.0371
Previous Monthly High 83.082
Previous Monthly Low 81.5032
Daily Fibonacci 38.2% 82.1932
Daily Fibonacci 61.8% 82.2638
Daily Pivot Point S1 82.0444
Daily Pivot Point S2 81.9122
Daily Pivot Point S3 81.7454
Daily Pivot Point R1 82.3435
Daily Pivot Point R2 82.5103
Daily Pivot Point R3 82.6426


Share: Feed news

Information on these pages contains forward-looking statements that involve risks and uncertainties. Markets and instruments profiled on this page are for informational purposes only and should not in any way come across as a recommendation to buy or sell in these assets. You should do your own thorough research before making any investment decisions. FXStreet does not in any way guarantee that this information is free from mistakes, errors, or material misstatements. It also does not guarantee that this information is of a timely nature. Investing in Open Markets involves a great deal of risk, including the loss of all or a portion of your investment, as well as emotional distress. All risks, losses and costs associated with investing, including total loss of principal, are your responsibility. The views and opinions expressed in this article are those of the authors and do not necessarily reflect the official policy or position of FXStreet nor its advertisers. The author will not be held responsible for information that is found at the end of links posted on this page.

If not otherwise explicitly mentioned in the body of the article, at the time of writing, the author has no position in any stock mentioned in this article and no business relationship with any company mentioned. The author has not received compensation for writing this article, other than from FXStreet.

FXStreet and the author do not provide personalized recommendations. The author makes no representations as to the accuracy, completeness, or suitability of this information. FXStreet and the author will not be liable for any errors, omissions or any losses, injuries or damages arising from this information and its display or use. Errors and omissions excepted.

The author and FXStreet are not registered investment advisors and nothing in this article is intended to be investment advice.

Recommended content


Recommended content

Editors’ Picks

USD/JPY jumps above 156.00 on BoJ's steady policy

USD/JPY jumps above 156.00 on BoJ's steady policy

USD/JPY has come under intense buying pressure, surging past 156.00 after the Bank of Japan kept the key rate unchanged but tweaked its policy statement. The BoJ maintained its fiscal year 2024 and 2025 core inflation forecasts, disappointing the Japanese Yen buyers. 

USD/JPY News

AUD/USD consolidates gains above 0.6500 after Australian PPI data

AUD/USD consolidates gains above 0.6500 after Australian PPI data

AUD/USD is consolidating gains above 0.6500 in Asian trading on Friday. The pair capitalizes on an annual increase in Australian PPI data. Meanwhile, a softer US Dollar and improving market mood also underpin the Aussie ahead of the US PCE inflation data. 

AUD/USD News

Gold price flatlines as traders look to US PCE Price Index for some meaningful impetus

Gold price flatlines as traders look to US PCE Price Index for some meaningful impetus

Gold price lacks any firm intraday direction and is influenced by a combination of diverging forces. The weaker US GDP print and a rise in US inflation benefit the metal amid subdued USD demand. Hawkish Fed expectations cap the upside as traders await the release of the US PCE Price Index.

Gold News

Stripe looks to bring back crypto payments as stablecoin market cap hits all-time high

Stripe looks to bring back crypto payments as stablecoin market cap hits all-time high

Stripe announced on Thursday that it would add support for USDC stablecoin, as the stablecoin market exploded in March, according to reports by Cryptocompare.

Read more

US economy: Slower growth with stronger inflation

US economy: Slower growth with stronger inflation

The US Dollar strengthened, and stocks fell after statistical data from the US. The focus was on the preliminary estimate of GDP for the first quarter. Annualised quarterly growth came in at just 1.6%, down from the 2.5% and 3.4% previously forecast.

Read more

Forex MAJORS

Cryptocurrencies

Signatures