![]()
This week I’ve had the pleasure of teaching the Professional Futures trader class in my hometown of London. As usual it’s been a productive time, working with the students and getting to grips at a more advanced level with the core strategy used by Online Trading Academy which recognizes institutional supply and demand levels low risk and high reward trading opportunities. We have just completed the fourth day of five where a small part of the curriculum focuses on the practical uses of technical indicators of a more conventional variety, as well as detailing the benefits of trading currency futures.
As you know from reading my articles, I’m not a huge fan of traditional technical tools like moving averages, oscillators, and trend lines and the main reason for this is simply because all technical indicators lag behind the actual price itself, giving you a late signal each and every time. On the other hand, the beauty of learning to understand true price action by using a simple rule-based foundation strategy, is that as an objective trader, you can get close to truly recognizing how the biggest banks and institutions make money in financial markets. And who would want to follow them? They understand like we do that price is basically the only leading indicator in existence and when a market speculator gets the right education and support in understanding how to read major imbalances between the willing buyers and sellers in the marketplace, they will finally see consistency in their results.
The simple fact is that hitting your goals in today’s markets, is much more easily achievable when you can learn to identify major market moves and turns in advance of them happening. Obviously with this in mind the majority of our classroom based curriculum and our online extended learning track programs also known as the XLT, focus purely on learning our patented core strategy first and foremost. However, as I was teaching today to my students, once a student has a solid grasp on the essentials of the foundation strategy, we can then choose to employ the use of certain technical indicators in the decision making process but only as a support tool and not a decision making tool. Today we spent a decent amount of time working with one of the most famous of all of the indicators, the Bollinger Bands and I thought it would be useful to share a snippet from the class in this article.
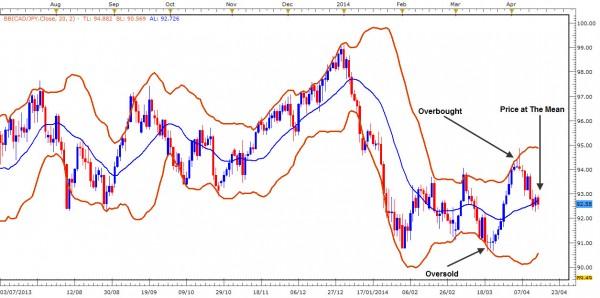
When placed on a price chart, the Bollinger Bands look like this:
The indicator is best described as a predictive volatility tool based on the current price action. The middle blue line that you can see on the example above is nothing more than a 20 period moving average. This represents the mean which as we know Price tends to revert to on numerous occasions and spends most of its time there throughout the trading day. The upper band and the lower band represent +2 Standard Deviations from the mean and -2 Standard Deviations from the mean respectively. In a nutshell the upper band and lower band could be said to be measurements of overbought and oversold market conditions and act like a prediction for where we could expect prices to rally and fall to based on the current mean, the moving average. When I’m teaching in class I like to describe the bands are something like a predictive price container. Essentially they give us a heads up of where prices could go to and come from. One of the biggest mistakes that traders make when using Bollinger Bands, is when they blindly buy oversold signals and sell overbought signals when the price pierces the upper or lower bands. Just like any other oscillator, markets can go overbought, oversold and stay that way for quite some time. The worst thing to happen is when you keep selling overbought conditions as the trend is still going up or vice versa when buying oversold signals when the trend is falling. Make no mistake, this can happen quite easily if you don’t know what you’re doing when using Bollinger Bands as well. If we learn to avoid blindly buying and selling because of the bands, then we can allow ourselves to use the indicator in a practical sense by combining it with a simple Price based strategy. I like to use the bands as a filter and scanning tool for moving through various trading opportunities. For example, if we look at the above example again we consider price is currently sitting at the mean, suggesting to us that now is not a great time to be getting into a trade as we’re stuck in the middle of nowhere, offering us a poor risk to reward scenario. With nothing more than a quick look at the chart, I can move on and go and find another opportunity that looks more suitable. Let’s take a look at a scenario which is much more appealing:
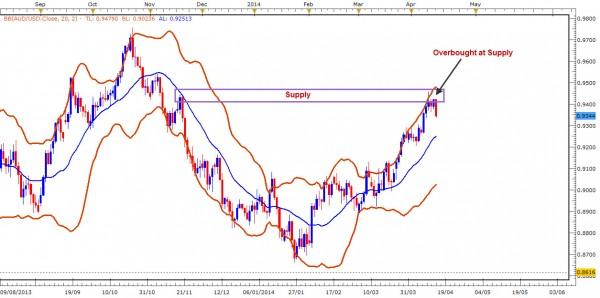
The above chart is a great example of where Bollinger Bands can be really useful. In this instance we do have the typical overbought piercing of the upper band, suggesting to us that the market is at an extreme in relation to its average price. However, we also triggered a quality area of supply where we would’ve been happy to take a low risk and high potential reward shorting opportunity. Unfortunately the trade has already triggered but I wanted to show you an example of something where the bands are really worth using.
In my own trading I use the bands as a powerful filtering tool to find quality levels of supply and demand for trades. As I look at all the asset classes from Forex, Equities, Futures and Options, it can take some time to get through all those markets and this is where the bands become invaluable. Using a powerful scanning tool, I can quickly find market extremes at the bands and then all I need to do on the markets that qualify, is to find areas of imbalance which respect my odds enhancers and the risk to reward ratios I’m looking for. I would never use a Bollinger band overbought or oversold signal alone to take a trade as this is far too conventional and relies on nothing more than a signal without a true heads up of price itself. If we’re willing to put the time and effort in though, the Bollinger bands as well as many other conventional technical tools can be powerful additions to a solid and simple rules based strategy which is based on the only leading indicator of all: Price. I hope you found this useful as an alternative way of looking at indicators.
The information provided is for informational purposes only. It does not constitute any form of advice or recommendation to buy or sell any securities or adopt any investment strategy mentioned. It is intended only to provide observations and views of the author(s) or hosts at the time of writing or presenting, both of which are subject to change at any time without prior notice. The information provided does not have regard to specific investment objectives, financial situation, or specific needs of any specific person who may read it. Investors should determine for themselves whether a particular service or product is suitable for their investment needs or should seek such professional advice for their particular situation. Please see our website for more information: https://bustamanteco.com/privacy-policy/
Editors’ Picks

Gold surges to fresh record high above $3,400
Gold extends its uptrend and trades at a new all-time high above $3,400 on Monday. Concerns over a further escalation in the US-China trade war and the Fed’s independence smash the US Dollar to three-year troughs, fuelling XAU/USD's rally.

EUR/USD clings to strong gains near 1.1500 on persistent USD weakness
EUR/USD gains more than 1% on the day and trades at its highest level since November 2021 near 1.1500. The relentless US Dollar selling helps the pair push higher as fears over a US economic recession and the Federal Reserve’s autonomy grow.

GBP/USD tests 1.3400 as USD selloff continues
GBP/USD continues its winning streak, testing 1.3400 on Monday. The extended US Dollar weakness, amid US-Sino trade war-led recession fears and heightened threat to the Fed's independence, underpin the pair following the long weekend.

How to make sense of crypto recovery – Is it a buy or fakeout
Bitcoin (BTC), Ethereum (ETH) and XRP, the top three cryptocurrencies by market capitalization, extend their last week’s recovery on Monday, even as trader sentiment is hurt by the US President Donald Trump’s tariff policy and announcements.

Five fundamentals for the week: Traders confront the trade war, important surveys, key Fed speech Premium
Will the US strike a trade deal with Japan? That would be positive progress. However, recent developments are not that positive, and there's only one certainty: headlines will dominate markets. Fresh US economic data is also of interest.
RECOMMENDED LESSONS
Making money in forex is easy if you know how the bankers trade!
Discover how to make money in forex is easy if you know how the bankers trade!
5 Forex News Events You Need To Know
In the fast moving world of currency markets, it is extremely important for new traders to know the list of important forex news...
Top 10 Chart Patterns Every Trader Should Know
Chart patterns are one of the most effective trading tools for a trader. They are pure price-action, and form on the basis of underlying buying and...
7 Ways to Avoid Forex Scams
The forex industry is recently seeing more and more scams. Here are 7 ways to avoid losing your money in such scams: Forex scams are becoming frequent. Michael Greenberg reports on luxurious expenses, including a submarine bought from the money taken from forex traders. Here’s another report of a forex fraud. So, how can we avoid falling in such forex scams?
What Are the 10 Fatal Mistakes Traders Make
Trading is exciting. Trading is hard. Trading is extremely hard. Some say that it takes more than 10,000 hours to master. Others believe that trading is the way to quick riches. They might be both wrong. What is important to know that no matter how experienced you are, mistakes will be part of the trading process.

The Best brokers to trade EUR/USD
SPONSORED Discover the top brokers for trading EUR/USD in 2025. Our list features brokers with competitive spreads, fast execution, and powerful platforms. Whether you're a beginner or an expert, find the right partner to navigate the dynamic Forex market.


