Choosing which stock to trade is always a challenge. There are many screeners available either free or for a small subscription fee. While they can be helpful, another simple technique can be even better in narrowing your selection process and may even offer insight as to when the markets may start to turn themselves.
Markets go through a rotation that is common throughout the world. All modern capitalistic economies work in similar manners and I have applied this analysis with great success to the US, Singapore, European, UK, and Indian equity markets. Let’s face it – we are all people, driven by the same forces of fear and greed when playing in the markets. These emotions make our investing and trading very predictable.
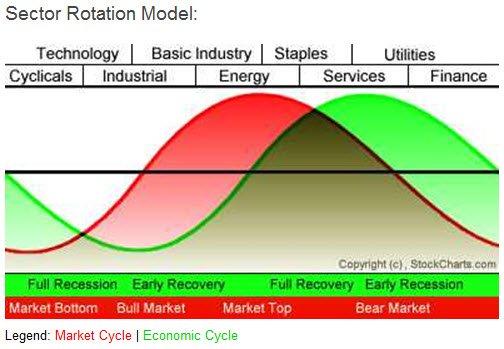
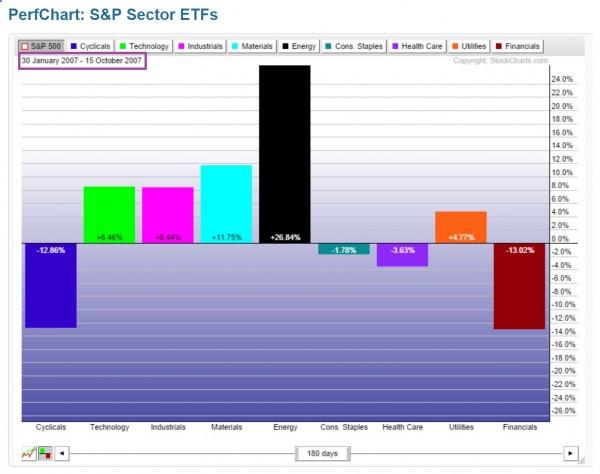
The stock market itself can be a leading indicator for the economy as investors place their money into “safe” sectors that they believe will outperform giving the future outlook of the economy. If you look at the chart below, you can see how the market cycle in red tends to lead the economic cycle in green by approximately three months. This makes sense when you think of how the markets turned downward in October 2007, well before the announcement that the United States and the rest of the world had entered into the 2008 recession.
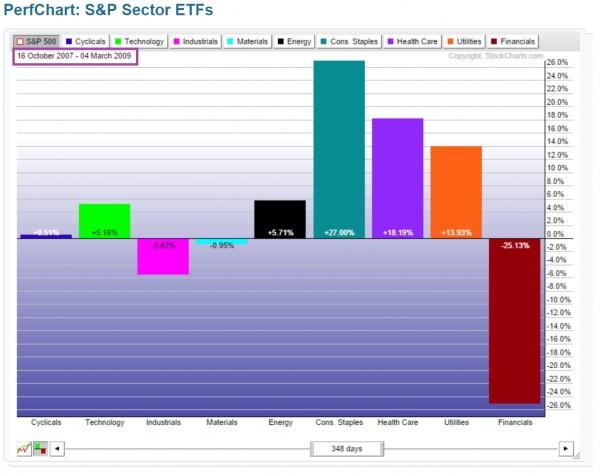
When there is danger on the horizon for the economy and markets, money will start to flow into sectors viewed as “safe havens.” Consumer Staples, Healthcare and Services and Utilities are examples of those safe investmenthaven sectors. The staples and healthcare are things we as a society still spend money on even if the economy starts to slump. Brokers advise their clients to protect their capital and you will see those sectors hold steady or even start to rise when danger appears or economic slowdown is imminent.
The utility sector is one that benefits in two ways from a bear market. First, this sector tends to pay out larger dividends than stocks in other sectors, so those seeking dividend yield are smart to invest here. Secondly, utility companies are usually operating on high debt having issued bonds to finance operations. If the economy is slumping, the Federal Reserve will lower interest rates as a move to stimulate it. The lower interest rate allows the utility company to re-issue new bonds at lower rates to pay off older, higher rate debt. This frees up money for them and increases profitability.
The last sector, Financials, also benefits from lower interest rates. In a lower interest rate environment, money can be borrowed for expanding business operations and consumer purchases to stimulate the economy. When businesses and investors think the end of the recession or slowdown is near, they will start to place money into financial stocks causing them to lead the markets out of the bearish mode.
This is a longer term cycle that could take four to eight years to complete and is therefore, more suited for investors or swing traders looking for signals or an advantage in trading. However, when you are an intraday trader, knowledge of this rotation can also be beneficial. On a day where the markets are bullish, the rotation model can tell you which sectors are best poised to move further in that direction thus improving your returns. The same is true for bearish market days.
So the big question on most investors’ and traders’ minds is whether the current market environment is going to continue to seek new highs or is primed for a crash. There is no doubt that the markets are overbought and valuations of many securities are extremely high. We can look to see what the sector rotation tells us about where those investors and traders expect both the markets and economy to head.
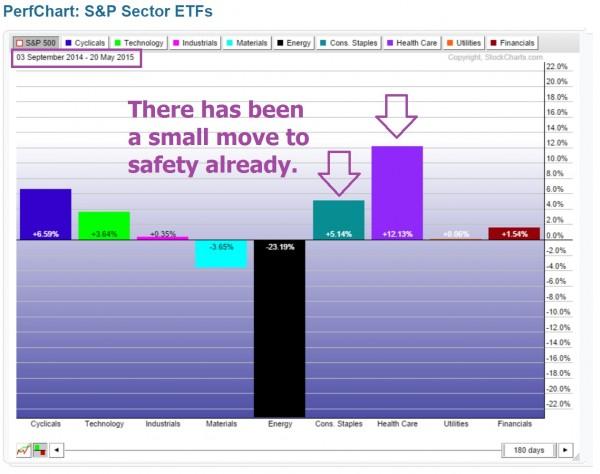
Looking at the sector rotation over the last six months, there has definitely been a shift into some of the “safety sectors” for investments. This would indicate that the markets are afraid of an imminent correction or crash coming. Should this trend continue, I would not be surprised to see the markets drop during the summer of this year
To learn more, I invite you to speak to an Education Counselor at our Online Trading Academy offices and enroll in our Professional Trader Course, and then to continue your education by joining the Extended Learning Track (XLT) program where we learn to identify the sector rotation using simple tools and analysis and many other techniques for improving your chances for trading success.
Neither Freedom Management Partners nor any of its personnel are registered broker-dealers or investment advisers. I will mention that I consider certain securities or positions to be good candidates for the types of strategies we are discussing or illustrating. Because I consider the securities or positions appropriate to the discussion or for illustration purposes does not mean that I am telling you to trade the strategies or securities. Keep in mind that we are not providing you with recommendations or personalized advice about your trading activities. The information we are providing is not tailored to any individual. Any mention of a particular security is not a recommendation to buy, sell, or hold that or any other security or a suggestion that it is suitable for any specific person. Keep in mind that all trading involves a risk of loss, and this will always be the situation, regardless of whether we are discussing strategies that are intended to limit risk. Also, Freedom Management Partners’ personnel are not subject to trading restrictions. I and others at Freedom Management Partners could have a position in a security or initiate a position in a security at any time.
Editors’ Picks

EUR/USD accelerates losses, focus is on 1.1800
EUR/USD’s selling pressure is gathering pace now, opening the door to a potential test of the key 1.1800 region sooner rather than later. The pair’s pullback comes on the back of marked gains in the US Dollar following US data releases and the publication of the FOMC Minutes later in the day.

GBP/USD turns negative near 1.3540
GBP/USD reverses its initial upside momentum and is now adding to previous declines, revisiting at the same time the 1.3540 region on Wednesday. Cable’s downtick comes on the back of decent gains in the Greenback and easing UK inflation figures, which seem to have reinforced the case for a BoE rate cut in March.

Gold battle to regain $5,000 continues
Gold is back on the front foot on Wednesday, shaking off part of the early week softness and challenging two-day highs just above the key $5,000 mark per troy ounce. The move comes ahead of the FOMC Minutes and is unfolding despite an intense rebound in the US Dollar.

Fed Minutes to shed light on January hold decision amid hawkish rate outlook
The Minutes of the Fed’s January 27-28 monetary policy meeting will be published today. Details of discussions on the decision to leave the policy rate unchanged will be scrutinized by investors.

Mixed UK inflation data no gamechanger for the Bank of England
Food inflation plunged in January, but service sector price pressure is proving stickier. We continue to expect Bank of England rate cuts in March and June. The latest UK inflation read is a mixed bag for the Bank of England, but we doubt it drastically changes the odds of a March rate cut.
RECOMMENDED LESSONS
Making money in forex is easy if you know how the bankers trade!
I’m often mystified in my educational forex articles why so many traders struggle to make consistent money out of forex trading. The answer has more to do with what they don’t know than what they do know. After working in investment banks for 20 years many of which were as a Chief trader its second knowledge how to extract cash out of the market.
5 Forex News Events You Need To Know
In the fast moving world of currency markets where huge moves can seemingly come from nowhere, it is extremely important for new traders to learn about the various economic indicators and forex news events and releases that shape the markets. Indeed, quickly getting a handle on which data to look out for, what it means, and how to trade it can see new traders quickly become far more profitable and sets up the road to long term success.
Top 10 Chart Patterns Every Trader Should Know
Chart patterns are one of the most effective trading tools for a trader. They are pure price-action, and form on the basis of underlying buying and selling pressure. Chart patterns have a proven track-record, and traders use them to identify continuation or reversal signals, to open positions and identify price targets.
7 Ways to Avoid Forex Scams
The forex industry is recently seeing more and more scams. Here are 7 ways to avoid losing your money in such scams: Forex scams are becoming frequent. Michael Greenberg reports on luxurious expenses, including a submarine bought from the money taken from forex traders. Here’s another report of a forex fraud. So, how can we avoid falling in such forex scams?
What Are the 10 Fatal Mistakes Traders Make
Trading is exciting. Trading is hard. Trading is extremely hard. Some say that it takes more than 10,000 hours to master. Others believe that trading is the way to quick riches. They might be both wrong. What is important to know that no matter how experienced you are, mistakes will be part of the trading process.
The challenge: Timing the market and trader psychology
Successful trading often comes down to timing – entering and exiting trades at the right moments. Yet timing the market is notoriously difficult, largely because human psychology can derail even the best plans. Two powerful emotions in particular – fear and greed – tend to drive trading decisions off course.


