Many students email me wanting to know how to tell if a supply or demand zone is likely to hold or break. Understanding this is critical for trading, for if we buy or sell at the wrong time we give up the opportunity to make greater profits or worse, we lose money.
In the Online Trading Academy’s Professional Trader Course as well as the Extended Learning Track, we stress the importance of our Odds Enhancers as a way to filter out weak opportunities and find the best trades that we should take. Although the strategy of using Supply and Demand is relatively simple, traders and investors must know that not every turning point in the market is a high quality trading opportunity. There are many Odds Enhancers, but with knowledge and practice using them becomes second nature and your consistency in the markets generally improves.
An Odds Enhancer that we look at when determining the strength of a zone is how price left that zone. Think of a glass of water sitting on a table. If you were to grab the glass only to find it filled with scalding hot water, you are likely to release your grip very quickly. But if the glass was filled with room temperature water you could hold the glass as long as you would like or even take a sip.
Price works the same way. Traders need to focus on the strength at which price left the origin of the supply or demand zone. If price leaves quickly, it shows a large imbalance of supply and demand and, therefore, a stronger zone.
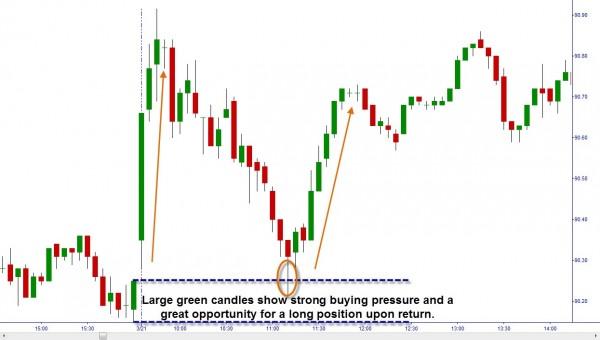
Looking at the following chart we can see that we left the demand zone with large green candles when demand was formed. This means that this is an area where buyers are much stronger than the sellers. The glass is hot! When price returns to that level we would have a high probability buying opportunity since the sellers are weak there and price is likely to rise again.
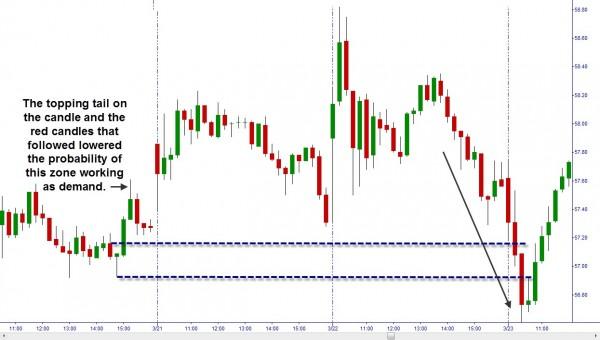
What happens if we leave the area slowly? We would likely see smaller candles and/or a mix or red and green candles. The battle between buyers and sellers is pretty even and no one side has the major advantage. Without clear direction in this zone, prices are less likely to bounce fast.
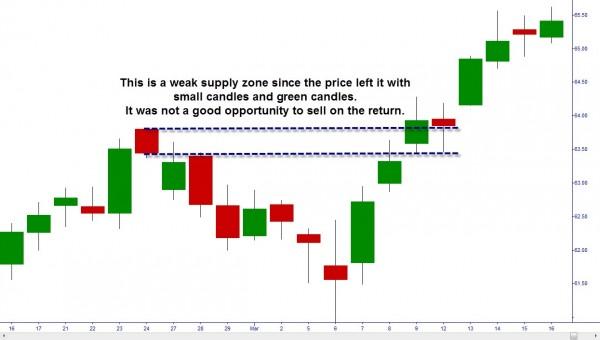
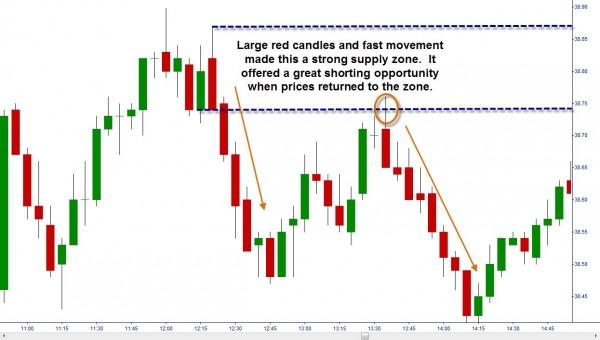
The same can be said for supply zones. For the zone to offer us a higher probability selling opportunity we would want to see a fast drop from that level. On the charts this would be characterized by large red candles, gaps down and/or topping tails on the candles.
If you do not see that occurring you would have a lower probability of success in selling at those levels.
So, now you are aware of one of the Odds Enhancers we can use to increase our chances for success in trading any market and any time frame. To learn the others join us at one of our worldwide education centers and increase your knowledge.
Editors’ Picks

EUR/USD stays weak near 1.1850 after dismal German ZEW data
EUR/USD remains in the red near 1.1850 in the European session on Tuesday. A broad US Dollar bullish consolidation combined with a softer risk tone keep the pair undermined alongside downbeat German ZEW sentiment readings for February.

GBP/USD holds losees near 1.3600 after weak UK jobs report
GBP/USD is holding moderate losses near the 1.3600 level in Tuesday's European trading. The United Kingdom employment data suggested worsening labor market conditions, bolstering bets for a BoE interest rate cut next month. This narrative keeps the Pound Sterling under bearish pressure.

Gold pares intraday losses; keeps the red above $4,900 amid receding safe-haven demand
Gold (XAU/USD) attracts some follow-through selling for the second straight day and dives to over a one-week low, around the $4,858 area, heading into the European session on Tuesday.

Canada CPI expected to show sticky inflation in January, still above BoC’s target
Economists see the headline CPI rising by 2.4% in a year to January, still above the BoC’s target and matching December’s increase. On a monthly basis, prices are expected to rise by 0.1%.

UK jobs market weakens, bolstering rate cut hopes
In the UK, the latest jobs report made for difficult reading. Nonetheless, this represents yet another reminder for the Bank of England that they need to act swiftly given the collapse in inflation expected over the coming months.
RECOMMENDED LESSONS
Making money in forex is easy if you know how the bankers trade!
I’m often mystified in my educational forex articles why so many traders struggle to make consistent money out of forex trading. The answer has more to do with what they don’t know than what they do know. After working in investment banks for 20 years many of which were as a Chief trader its second knowledge how to extract cash out of the market.
5 Forex News Events You Need To Know
In the fast moving world of currency markets where huge moves can seemingly come from nowhere, it is extremely important for new traders to learn about the various economic indicators and forex news events and releases that shape the markets. Indeed, quickly getting a handle on which data to look out for, what it means, and how to trade it can see new traders quickly become far more profitable and sets up the road to long term success.
Top 10 Chart Patterns Every Trader Should Know
Chart patterns are one of the most effective trading tools for a trader. They are pure price-action, and form on the basis of underlying buying and selling pressure. Chart patterns have a proven track-record, and traders use them to identify continuation or reversal signals, to open positions and identify price targets.
7 Ways to Avoid Forex Scams
The forex industry is recently seeing more and more scams. Here are 7 ways to avoid losing your money in such scams: Forex scams are becoming frequent. Michael Greenberg reports on luxurious expenses, including a submarine bought from the money taken from forex traders. Here’s another report of a forex fraud. So, how can we avoid falling in such forex scams?
What Are the 10 Fatal Mistakes Traders Make
Trading is exciting. Trading is hard. Trading is extremely hard. Some say that it takes more than 10,000 hours to master. Others believe that trading is the way to quick riches. They might be both wrong. What is important to know that no matter how experienced you are, mistakes will be part of the trading process.
The challenge: Timing the market and trader psychology
Successful trading often comes down to timing – entering and exiting trades at the right moments. Yet timing the market is notoriously difficult, largely because human psychology can derail even the best plans. Two powerful emotions in particular – fear and greed – tend to drive trading decisions off course.

