- Chainlink struggles to secure recovery as triangle pattern contributes to intensifying overhead pressure.
- The IOMAP illustrates a massive resistance likely to hinder upward price action.
- LINK may resume the uptrend if the MACD flips bullish in the near term.
Chainlink recently lost crucial support provided by a key technical pattern. This opened Pandora’s box as bulls focused on securing higher support. The area at $26 remained unbroken, with LINK making a shallow rebound above $27. However, LINK’s buyers seem to be struggling with the uptrend, a situation that brings to light potential losses aiming for $19.
Chainlink under increasing gravitational pull
Chainlink’s breakdown to $20 around mid-February culminated in a considerable recovery. However, LINK failed to overcome the resistance at $32, leading to an ascending triangle. On the downside, the decentralized Oracle token sustained an uptrend, forming the hypotenuse of the triangle.
A bullish breakout is expected once the price cracks the x-axis resistance. However, a correction came into the picture due to the price sliding under the ascending trend line. If the ongoing recovery does not overcome the hurdle at $30, Chainlink may extend the breakdown toward $19, as illustrated on the chart.
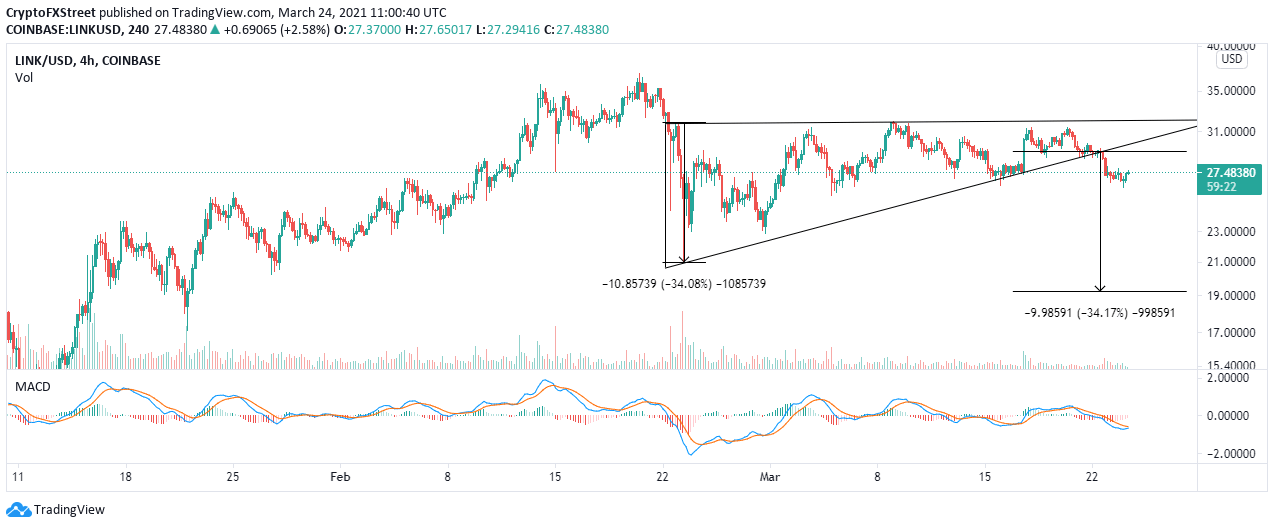
LINK/USD 4-hour chart
IntoTheBlock’s IOMAP chart highlights the immense resistance toward $30, thus invalidating recovery in the short term. The most robust seller congestion zone holds between $28.2 and $29. Here, 12,500 addresses had previously bought approximately 58.7 million LINK.
On the flip side, feeble support exists to prevent Chainlink from diving further. However, the model brings our attention to the region running from $26.5 to $27.4. Here, roughly 14,600 addresses had previously scooped up around 6.3 million LINK. This support, however, does not seem strong enough to avert the potential losses.
-637521829277885490.png)
Chainlink IOMAP chart
Looking at the other side of the picture
The 4-hour Moving Average Convergence Divergence (MACD) indicator shows a potentially bullish scenario. This bullish outlook will be validated by the MACD line (blue) crossing above the signal line. Moreover, the indicator must move into positive territory to ascertain the uptrend to higher price levels.
Information on these pages contains forward-looking statements that involve risks and uncertainties. Markets and instruments profiled on this page are for informational purposes only and should not in any way come across as a recommendation to buy or sell in these assets. You should do your own thorough research before making any investment decisions. FXStreet does not in any way guarantee that this information is free from mistakes, errors, or material misstatements. It also does not guarantee that this information is of a timely nature. Investing in Open Markets involves a great deal of risk, including the loss of all or a portion of your investment, as well as emotional distress. All risks, losses and costs associated with investing, including total loss of principal, are your responsibility. The views and opinions expressed in this article are those of the authors and do not necessarily reflect the official policy or position of FXStreet nor its advertisers. The author will not be held responsible for information that is found at the end of links posted on this page.
If not otherwise explicitly mentioned in the body of the article, at the time of writing, the author has no position in any stock mentioned in this article and no business relationship with any company mentioned. The author has not received compensation for writing this article, other than from FXStreet.
FXStreet and the author do not provide personalized recommendations. The author makes no representations as to the accuracy, completeness, or suitability of this information. FXStreet and the author will not be liable for any errors, omissions or any losses, injuries or damages arising from this information and its display or use. Errors and omissions excepted.
The author and FXStreet are not registered investment advisors and nothing in this article is intended to be investment advice.
Recommended Content
Editors’ Picks

Dogecoin bulls defend lifeline support as risk-off sentiment continues
Dogecoin price stays below three major daily moving averages after Elon Musk severed perceived ties to D.O.G.E., the agency. Uncertainty in global markets over Trump’s tariff war heightens risk-off sentiment.

Bitcoin recovers as dominance increases, signaling a shift amid market stress
Bitcoin price recovers slightly, trading above $84,000 on Tuesday after falling 4.29% the previous week. Crypto Finance reports that Bitcoin’s dominance rose to 61.4%, reflecting a shift toward BTC as a resilient asset amid market stress.

Solana Policy Institute launch to shape policies for decentralized networks
Solana Policy Institute aims to educate policymakers on decentralized networks like Solana. SPI plans to unite Solana's ecosystem voices to demonstrate the technology's economic and social benefits amid debates over its decentralization and reliability.

Tether adds to Bitcoin reserves with over $735 million withdrawals from the Bitfinex hot wallet
Arkham intelligence data shows that Tether added 8,888 BTC worth $735 million from the Bitfinex hot wallet. The address currently holds 92,000 BTC, worth $7.65 billion, and is also the sixth-ranked BTC wallet address.

Bitcoin: BTC remains calm before a storm
Bitcoin's price has been consolidating between $85,000 and $88,000 this week. A K33 report explains how the markets are relatively calm and shaping up for volatility as traders absorb the tariff announcements. PlanB’s S2F model shows that Bitcoin looks extremely undervalued compared to Gold and the housing market.

The Best brokers to trade EUR/USD
SPONSORED Discover the top brokers for trading EUR/USD in 2025. Our list features brokers with competitive spreads, fast execution, and powerful platforms. Whether you're a beginner or an expert, find the right partner to navigate the dynamic Forex market.