USD/CAD shows weak signs below double top at 1.2960 – GBP/JPY bullish trend dims [Video]
![USD/CAD shows weak signs below double top at 1.2960 – GBP/JPY bullish trend dims [Video]](https://editorial.fxstreet.com/images/Markets/Currencies/Majors/USDCAD/dollars-11347249_XtraLarge.jpg)
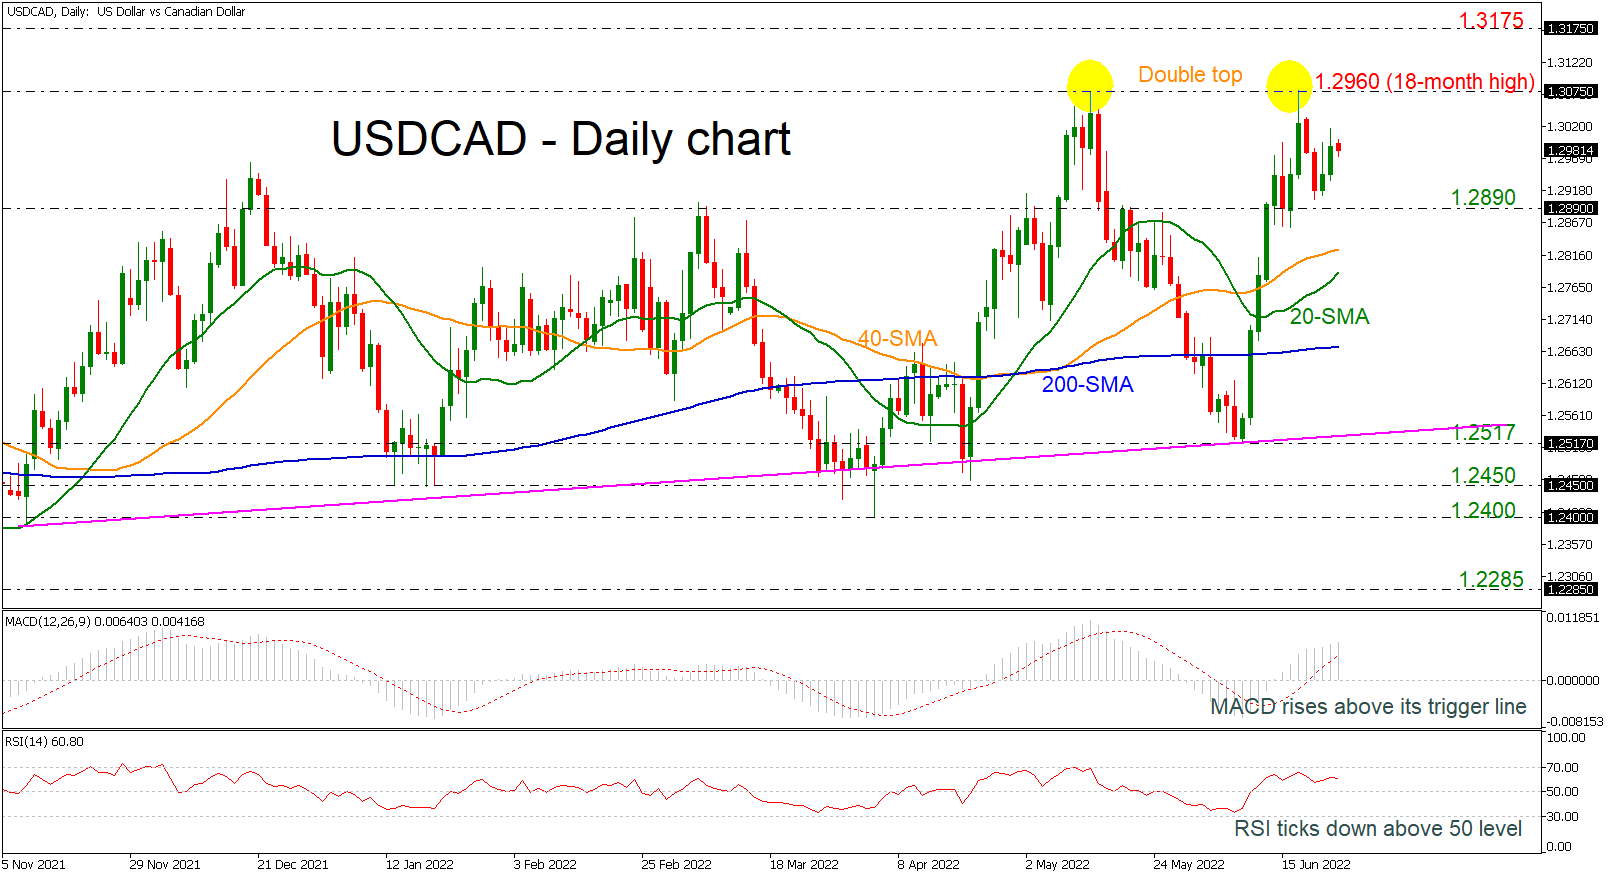
USD/CAD shows weak signs below double top at 1.2960
USDCAD is showing some weak signs today with the technical indicators confirming this view. The RSI indicator is moving south in the positive region, while the MACD oscillator is holding above its trigger and zero lines, but with softer momentum than before.
The price posted a double top around the 18-month high of 1.2960 in the previous weeks and any moves higher could boost the long-term bullish outlook. Moving up, the price may meet the 1.3175 barrier, taken from the peak of November 2020, ahead of the 1.3420 level, registered in September 2020.
On the other hand, if the price heads down, immediate support could come from the 1.2980 support and the 40- and 20-day simple moving averages (SMAs) at 1.2825 and 1.2785, respectively. A drop lower may drive the bears until the flat 200-day SMA at 1.2660 before tumbling to 1.2517.
All in all, USDCAD has been in an advancing mode over the last seven months, though only a significant climb above the double top may endorse this positive outlook.
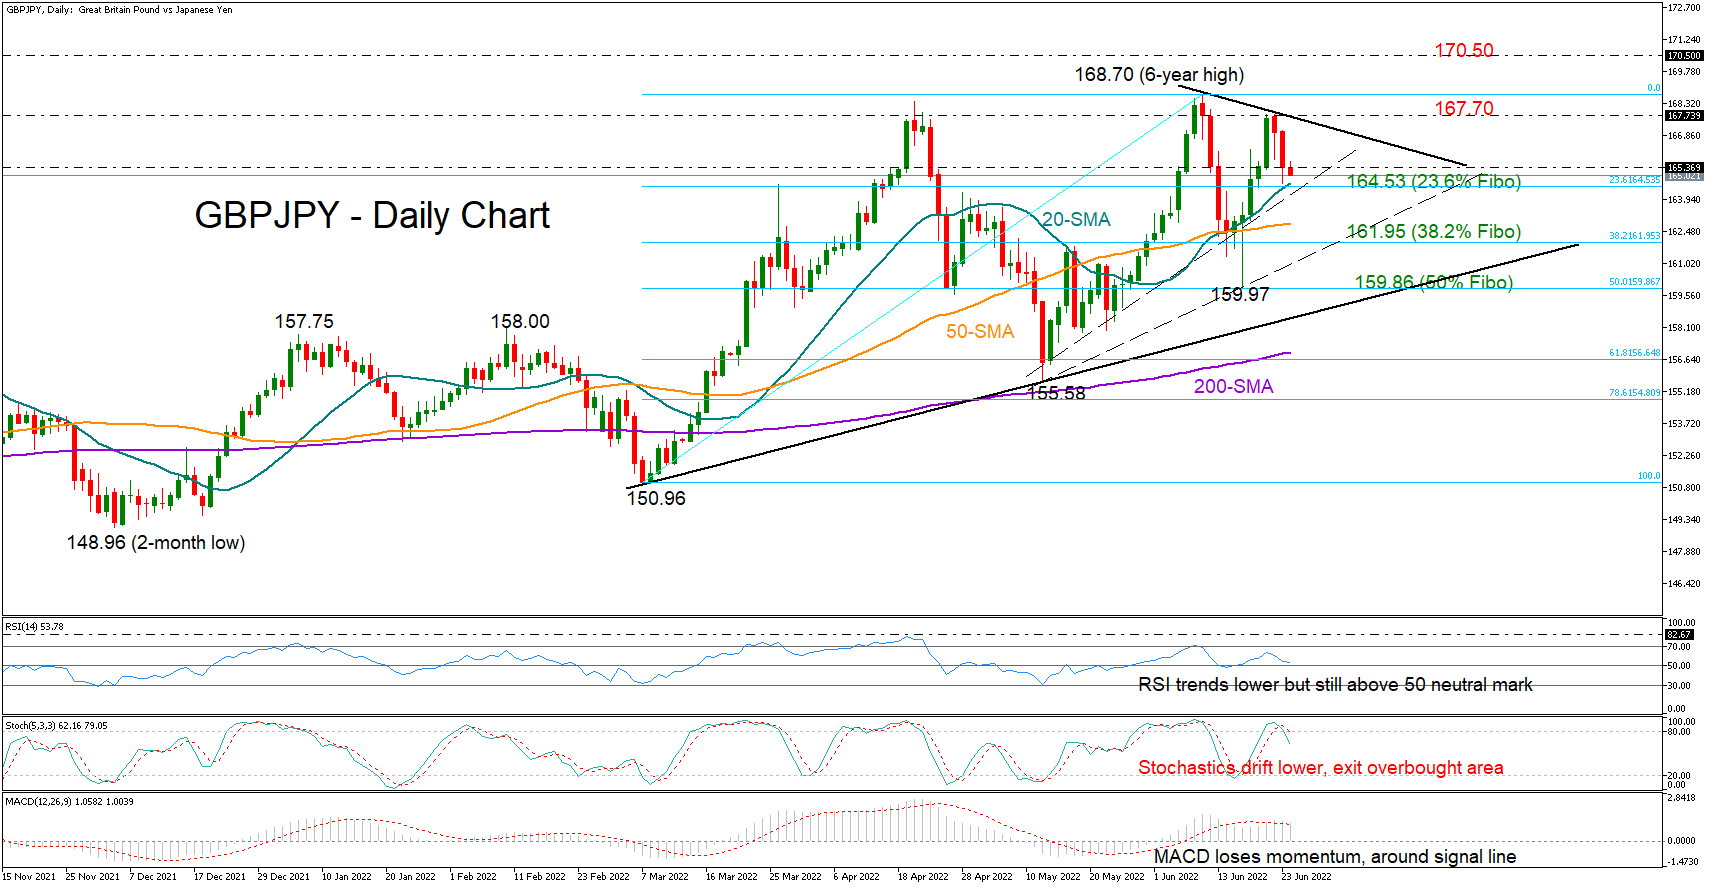
GBP/JPY bullish trend dims
GBPJPY is mirroring fading buying interest as negative momentum escalated on Thursday, confirming a lower high at 167.82.
Similarly, the RSI seems to be following a negative trajectory after failing to reach its previous high, while the negative turn in the Stochastics and the MACD is also reflecting some discomfort among traders.
Optimism, however, has not completely vanished as the 20-day simple moving average (SMA), which has been a crucial support region over the past week, is still intact. The 23.6% Fibonacci retracement of the 150.96 – 168.70 upleg is also in the same neighborhood at 164.53 along with a dashed ascending trendline. If selling tendencies, however, break that floor, the 50-day SMA currently at 162.11 may immediately come under the spotlight ahead of the 50% Fibonacci of 161.95. Slightly lower, a tentative upward-sloping trendline may attract some attention around 161.00 before traders target the 61.8% Fibonacci of 159.86.
Alternatively, should the 20-day SMA cease downside pressures, the pair may push for a close above the short-term tentative resistance trendline and the 167.70 former restrictive zone. In case the bulls accelerate above the six-year high of 168.70 too, the next barricade may pop up somewhere near 170.50 taken from January-February 2016.
In brief, the positive trend in GBPJPY seems to be losing steam, though the bulls may not give up the battle yet unless the base at 164.53 collapses.
Author

Melina joined XM in December 2017 as an Investment Analyst in the Research department. She can clearly communicate market action, particularly technical and chart pattern setups.


