Technical analysis: Will USD/ZAR quotes continue to decline?
USD/ZAR technical analysis summary
Below 16,84.
Sell Stop.
Above 18,52.
Stop Loss.
| Indicator | Signal |
| RSI | Neutral |
| MACD | Sell |
| MA(200) | Neutral |
| Fractals | Sell |
| Parabolic SAR | Sell |
| Bollinger Bands | Neutral |
USD/ZAR chart analysis
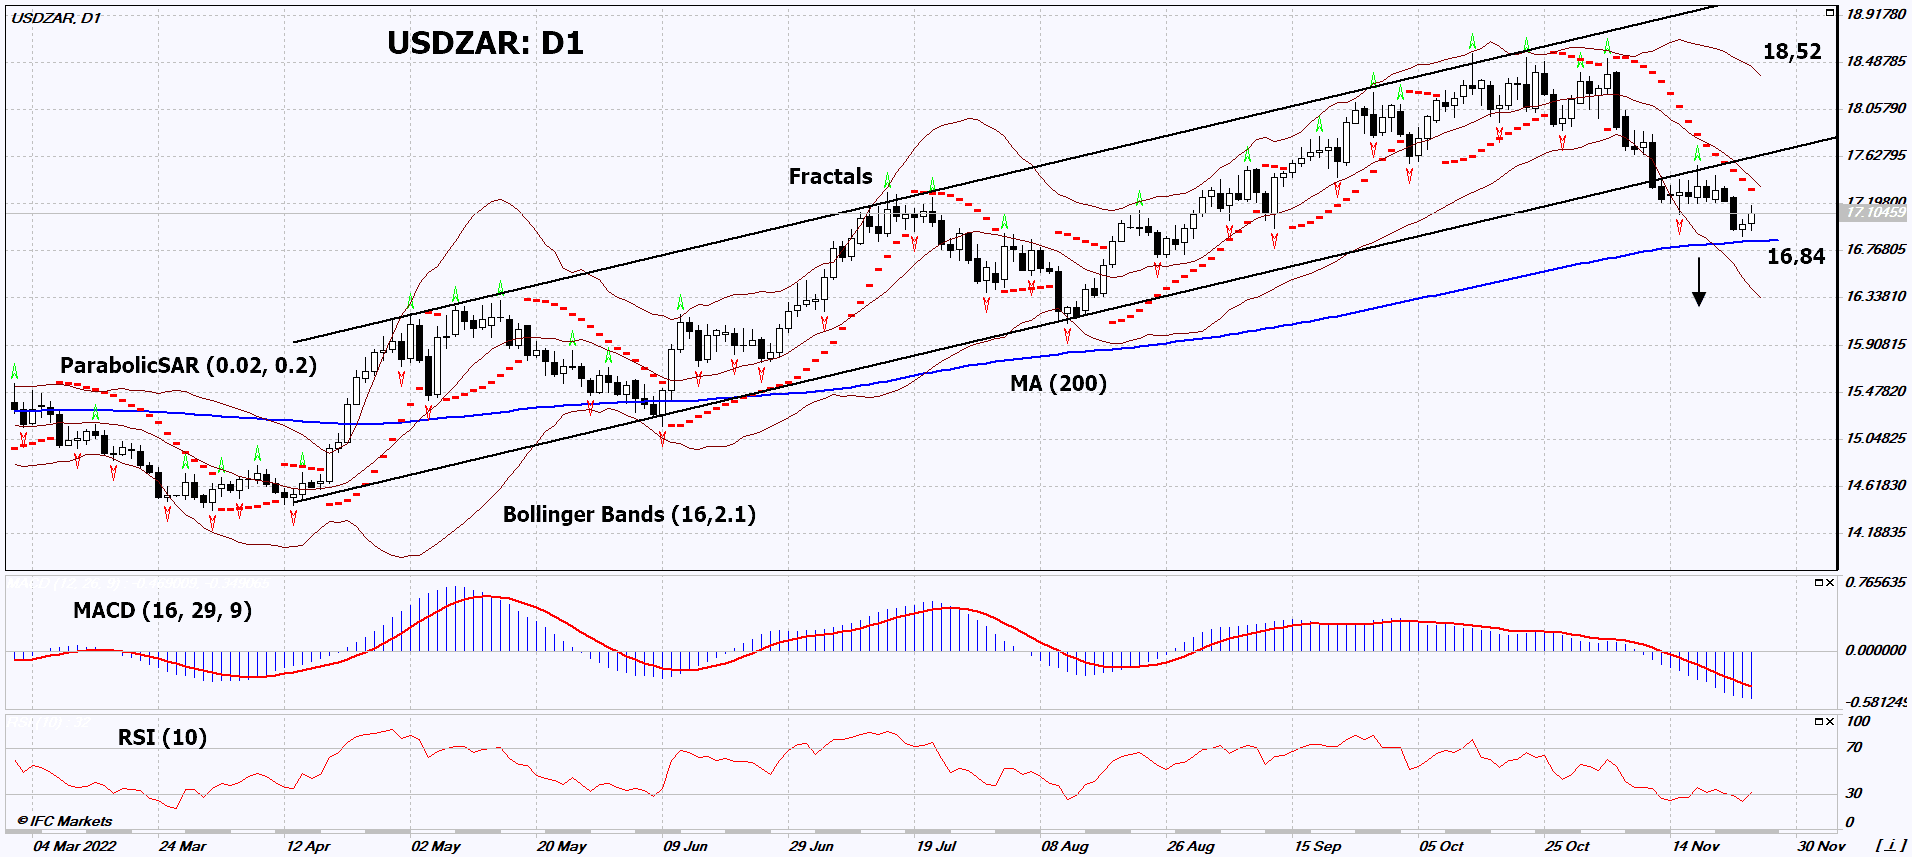
On the daily timeframe, USDZAR: D1 broke down the support line of the rising channel and approached the 200-day moving average line. It must be broken down before opening a position. A number of technical analysis indicators formed signals for further decline. We do not rule out a bearish movement if USDZAR: D1 drops below the 200-day moving average of 16.84. This level can be used as an entry point. The initial risk limit is possible above the last 2 upper fractals, the upper Bollinger band and the Parabolic signal: 18.52. After opening a pending order, we move the stop following the Bollinger and Parabolic signals to the next fractal maximum. Thus, we change the potential profit/loss ratio in our favor. The most cautious traders, after making a trade, can switch to a four-hour chart and set a stop loss, moving it in the direction of movement. If the price overcomes the stop level (18.52) without activating the order (16.84), it is recommended to delete the order: there are internal changes in the market that were not taken into account.
Fundamental analysis of forex - USD/ZAR
South African Reserve Bank raised the rate. Will USDZAR quotes continue to decline?
The South African Central Bank raised the rate to 7% from 6.25%. Now it has almost caught up with inflation, which was +7.6% y/y in October. This is not much more than September's +7.5% y/y. We note that the South Africa Producer Price Index (inflation in industry) in October fell to +16% y/y compared to +16.3% y/y in September. Signs of slowing inflation may support the quotes of the South African rand. November 29 in South Africa will be significant data on unemployment, November 30 - trade balance and December 1 - Absa South Africa Manufacturing Purchasing Managers Index (index of business activity in industry). There will be a lot of important statistics in the US this week, including the publication of the United States Nonfarm Payrolls on December 2nd.
Want to get more free analytics? Open Demo Account now to get daily news and analytical materials.
Want to get more free analytics? Open Demo Account now to get daily news and analytical materials.
Author

Dmitry Lukashov
IFC Markets
Dimtry Lukashov is the senior analyst of IFC Markets. He started his professional career in the financial market as a trader interested in stocks and obligations.