The world has been in trouble ever since the US subprime mortgage crisis which developed within 2007 and 2008. From then on, and despite some temporal improvements, most major economies have been turning for the worse. Japan, the world's third-largest economy, is not an exception to this rule. Growth stagnated in the 1990s with the assets price bubble's collapse, and ever since, the government has been struggling to reignite the local economy and come out of deflation, with no lack of so far.
Shinzo Abe became Japan's Prime Minister in 2012 -he served as PM, also between 2006-2007- and launched "Abenomics", an economic program launched by Abe, based on what it was known as three arrows: dramatic monetary easing, a robust fiscal stimulus policy, and structural reforms' policies to spur private investment.
Let's take a look at each item:
When it comes to the monetary easing, the Bank of Japan has not deprived of anything, except for issuing 50-year bonds, something that can be considered as "helicopter money" -that is, the direct underwriting of government bonds by a central bank, which then holds them in perpetuity- a measure that arose lately, due to the lack of progress of Abenomics. The current easing program implies buying ¥ 80 trillion in government bond purchases per year, but at this point, the BOJ is running out of government bonds to buy, as the bond issuance pace planned by the Ministry of Finance is about half of what the Central Bank needs. The bright side of this unprecedented monetary easing is that the Japanese government can issue as many bonds as it wants, as most of the debt is owned by the same government, Japanese banks, and local citizens. But so far, the only ones benefiting from this measure are hedge funds.
As for the robust fiscal stimulus policy, a long-announced sale tax hike has been delayed more than once. In April 2014, the sales tax was hiked to 8% from previous 5%, when the congress passed a bill to move it up to 10% in October 2015. But to the economic situation, the tax was later delayed to 2017. Last June, Prime Minister Shinzo Abe decided to delay an increase in Japan’s sales tax until 2019, by stating that “I decided that I should delay the sales tax increase because it might damage domestic demand.”
Some structural reforms have been actually implemented, but many called it the "missing arrow," given that the most successful measures so far have been implemented in the agricultural sector, not enough to trigger confidence among foreign investors over the future of Japan's economic growth. In fact, a group of major US companies in Japan urged the government to implement a more structural reform last March.
Abenomics is treating the symptoms while ignoring the illness, something not actually surprising, given that is not the major economy doing so (who remembers Jean-Claude Trichet before Mario Draghi?). In the meantime, Abe keeps saying that "Abenomics has been steadily producing results," but at this point, I'm not sure if he believes in himself.
What's ahead, then for the second quarter or 2016? In four words, more of the same
Early August, we knew that Abe's cabinet approved an economic stimulus package worth more than 28 trillion, which includes ¥7.5 trillion in new spending for the national and local governments over the next two years, less than a third of the total in direct spending. The rest, will be applied to infrastructure projects, including the reconstruction of the southern region hit by earthquakes in April. Full details of the program will be unveiled after it's compiled, sometime this August.
Markets´ reacted negatively to the announcement, as tax revenues aren't rising, while is not clear from where the extra funds needed are going to come from. Yen's continued strength suggests that, at this point, speculative interest is seeing this announcement as another bluff, after the many offered by the BOJ over these last four years.
In the meantime, a new crisis is developing. Or maybe two. The Bank of Japan disappointed markets in its latest meeting, by keeping rates, and its bond purchases program unchanged. Basically, no matter how much more stimulus the bank wants to add, there are not enough bonds to buy. That's the first one. What can the bank do then?
Well, the correct answer will be to raise the sales tax. Something markets are not considering these days, is that Japan's population is aging. With less people in the workforce and more outside, the high savings rate of the country will likely start to fall, and therefore, all of the famous Mrs. Watanabe won't be able to absorb government's debt. Not to mention that the sales tax hike has been once again delayed, as commented above. Or that last July, Japan slashed its GDP growth forecast down to 0.9% for this 2016. The inflation forecast was also downgraded to a rise of 0.4%, versus an earlier projection of 1.2%.
In this scenario, there's an obvious question: Why is the yen so strong, when the economy is doing so bad?
Firstly, due to the high levels of uncertainty surrounding most major economies, added to the Chinese slowdown, both fueling demand for the safe-haven asset. Secondly, because of local shares falling. The Nikkei 225 has been declining ever since topping around 21,000 over a year ago, as investors got spooked by BOJ's decision to cut rates into negative territory, a sign that is running out of tools to fight dismal growth and deflation. Quite a popular investment strategy is buying Japanese stocks while shorting the yen. When the Nikkei falls, those shorts get unwinded. Foreign investors make up around the 60% of the trading volume. Finally, the Japanese yen keeps strengthening because of dollar's self-weakness, as markets believe that the FED has put the next rate hike in the US to sleep until late 2017.
At this point, every new announcement, either by the government or the BOJ, is seen as a last ditch effort in a sea of red. And confidence in the unforeseeable upcoming Japanese growth keeps eroding. That said, there's little to expect from the Japanese economy for the rest of this 2016, and probably all through 2017.
USD/JPY Technical outlook

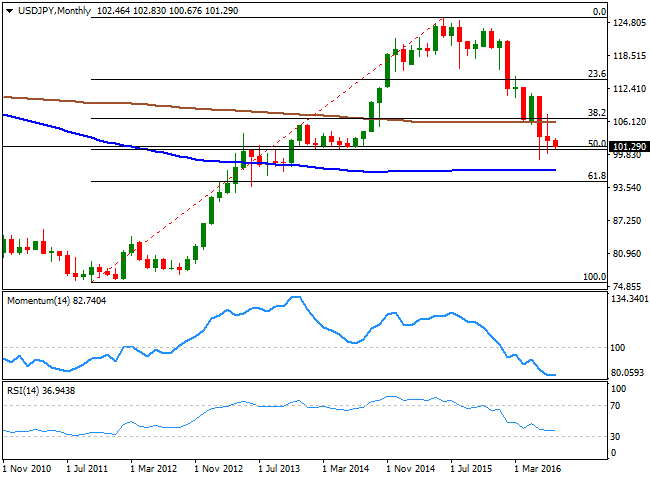
The USD/JPY trades near over two-year lows, dangerously close to the 100.00 mark, and seems poised to extend such decline, although it's now trading at a major support region, the 50% retracement of the post-Abenomics rally, around 100.60, measured from 75.56, November 2011 low, to 125.85, June 2015 high. Daily, weekly, and monthly charts all present strongly bearish technical readings, aligned with the macroeconomic background, and therefore supporting a break below the mentioned 100.00. In that case, the next probable bearish target comes at 94.70, the 61.8% retracement of the mentioned rally.
A recovery, on the other hand, needs to extend beyond 106.50, the 38.2% retracement of it, to be able to become sustainable in time. These days, the 100 DMA stands also around the mentioned 106.50 level. The price is 500 pips below it, something that any currency pair, can move in a couple of weeks. Any, but the USD/JPY.
As long as the FED remains on hold, chances of a recovery in the pair will remain limited, nowhere near such 106.50. A surprise US rate hike before the year's end is the only game-changer strong enough to put the pair back in the bullish track.
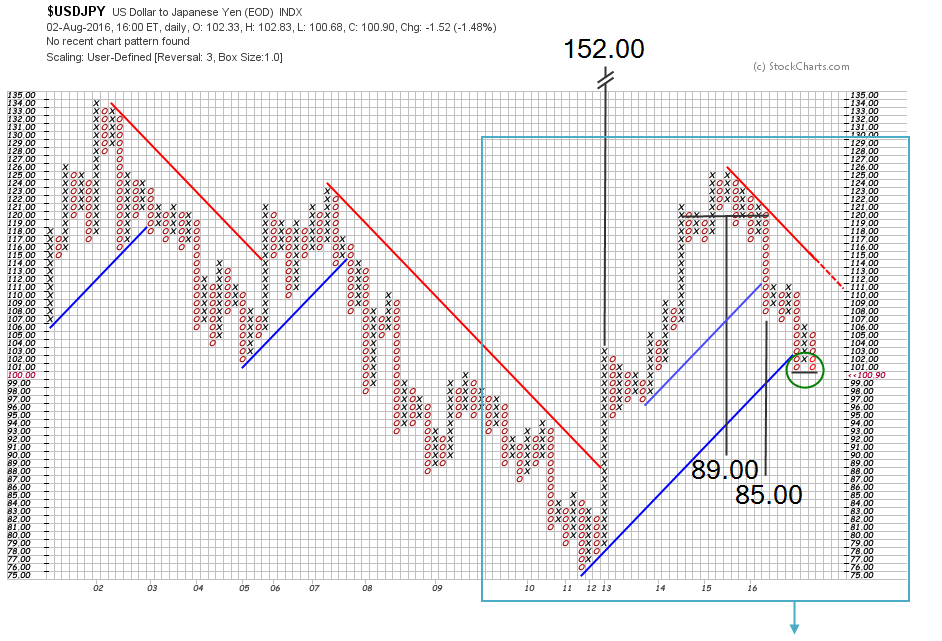
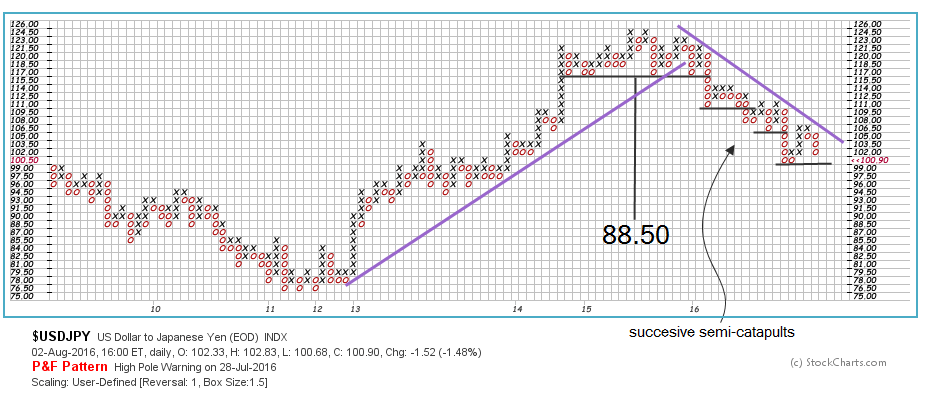
USD/JPY Point & Figure Analysis, by Gonçalo Moreira
Information on these pages contains forward-looking statements that involve risks and uncertainties. Markets and instruments profiled on this page are for informational purposes only and should not in any way come across as a recommendation to buy or sell in these assets. You should do your own thorough research before making any investment decisions. FXStreet does not in any way guarantee that this information is free from mistakes, errors, or material misstatements. It also does not guarantee that this information is of a timely nature. Investing in Open Markets involves a great deal of risk, including the loss of all or a portion of your investment, as well as emotional distress. All risks, losses and costs associated with investing, including total loss of principal, are your responsibility. The views and opinions expressed in this article are those of the authors and do not necessarily reflect the official policy or position of FXStreet nor its advertisers. The author will not be held responsible for information that is found at the end of links posted on this page.
If not otherwise explicitly mentioned in the body of the article, at the time of writing, the author has no position in any stock mentioned in this article and no business relationship with any company mentioned. The author has not received compensation for writing this article, other than from FXStreet.
FXStreet and the author do not provide personalized recommendations. The author makes no representations as to the accuracy, completeness, or suitability of this information. FXStreet and the author will not be liable for any errors, omissions or any losses, injuries or damages arising from this information and its display or use. Errors and omissions excepted.
The author and FXStreet are not registered investment advisors and nothing in this article is intended to be investment advice.
Recommended Content
Editors’ Picks

EUR/USD accelerates losses to 1.0930 on stronger Dollar
The US Dollar's recovery regains extra impulse sending the US Dollar Index to fresh highs and relegating EUR/USD to navigate the area of daily troughs around 1.0930 in the latter part of Friday's session.

GBP/USD plummets to four-week lows near 1.2850
The US Dollar's rebound keep gathering steam and now sends GBP/USD to the area of multi-week lows in the 1.2850 region amid the broad-based pullback in the risk-associated universe.

Gold trades on the back foot, flirts with $3,000
Gold prices are accelerating their daily decline, steadily approaching the critical $3,000 per troy ounce mark as the Greenback's rebound gains extra momentum and US yields tighten their retracement.

Can Maker break $1,450 hurdle as whales launch buying spree?
Maker holds steadily above $1,250 support as a whale scoops $1.21 million worth of MKR. Addresses with a 100k to 1 million MKR balance now account for 24.27% of Maker’s total supply. Maker battles a bear flag pattern as bulls gather for an epic weekend move.

Strategic implications of “Liberation Day”
Liberation Day in the United States came with extremely protectionist and inward-looking tariff policy aimed at just about all U.S. trading partners. In this report, we outline some of the more strategic implications of Liberation Day and developments we will be paying close attention to going forward.

The Best brokers to trade EUR/USD
SPONSORED Discover the top brokers for trading EUR/USD in 2025. Our list features brokers with competitive spreads, fast execution, and powerful platforms. Whether you're a beginner or an expert, find the right partner to navigate the dynamic Forex market.

