USD/CHF: Is it going back to parity again?
USD/CHF produced an inside bar bullish candle after making a bullish breakout at a significant level of resistance. The pair has been bullish for a week upon creating a double bottom on the daily chart. The daily chart suggests that the pair may head towards the massive round number 1.0000 again. It is a long way to go, but as things stand with the pair, it is very much on the card. The major intraday charts, such as the H4 chart, look very bullish, whereas the H1 chart looks a bit neutral. Let us have a look at those three charts.
Chart 1 USD/CHF Daily Chart
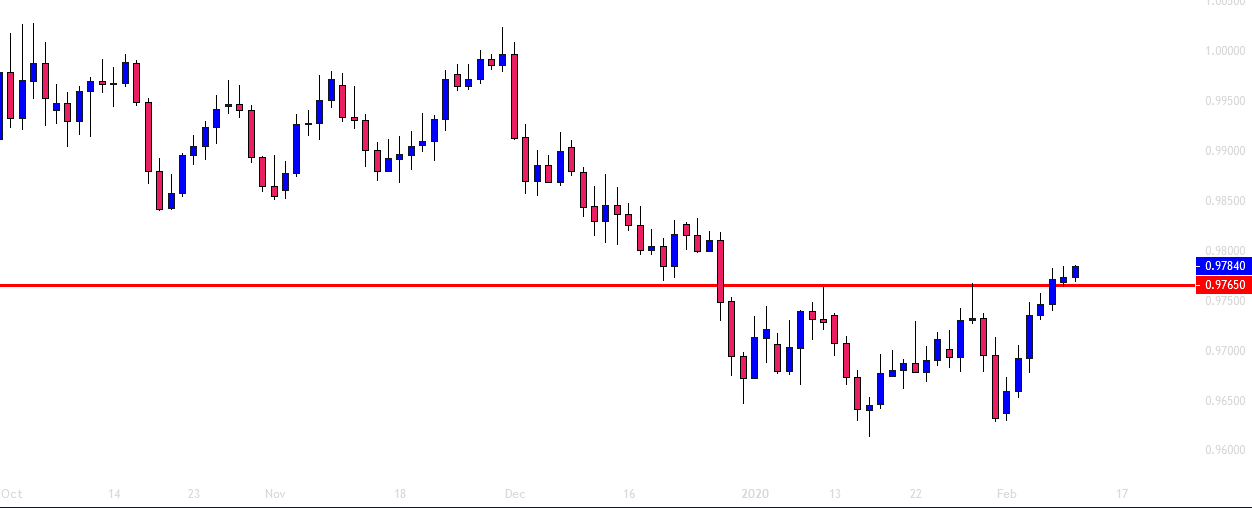
The chart shows that Friday’s daily candle closes above the level of 0.97650. This is where the price had rejection twice earlier. Yesterday’s daily candle closed above the level as well. Thus, the buyers may consider it as breakout confirmation. The daily buyers may trigger a long entry above yesterday’s highest high. The price may find its next resistance around the level of 0.98290. Since the pair produced a double bottom and made a breakout at the neckline, most probably, the daily chart will make a breakout at the next resistance too.
Chart 2 USD/CHF H4 Chart
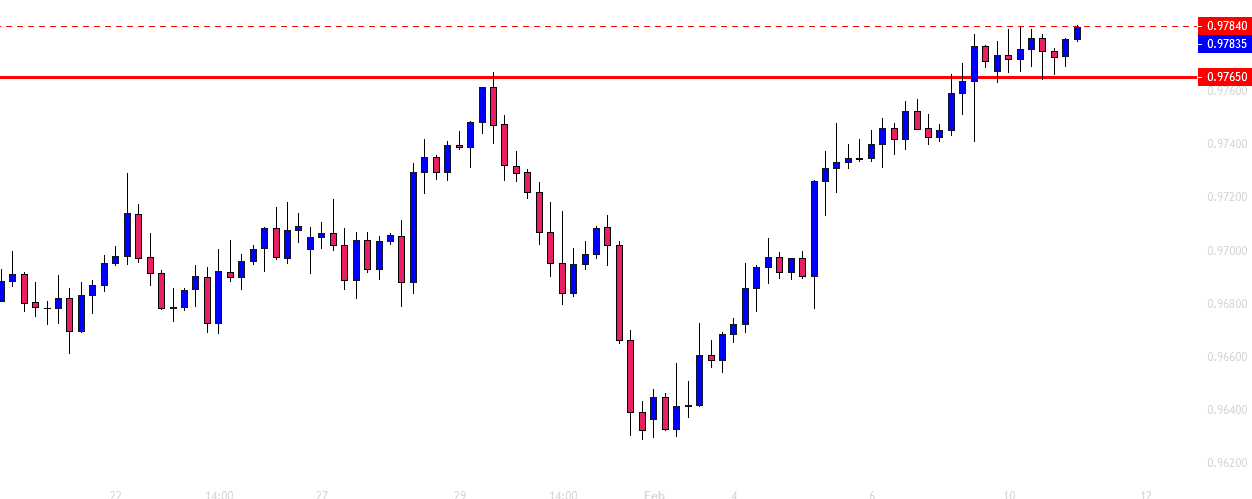
The chart shows that the price has been in consolidation for a long time. The level of 0.97650 has been working as the level of support, and the level of 0.97840 has been working as the level of resistance. The chart produced a bullish engulfing candle at the level of support. As of writing, the price has been bullish. It is trading right at the level of resistance. The buyers may go long above the level of 0.97840. The price may find its next resistance at the level of 0.98350.
Chart 3 USD/CHF H1 Chart
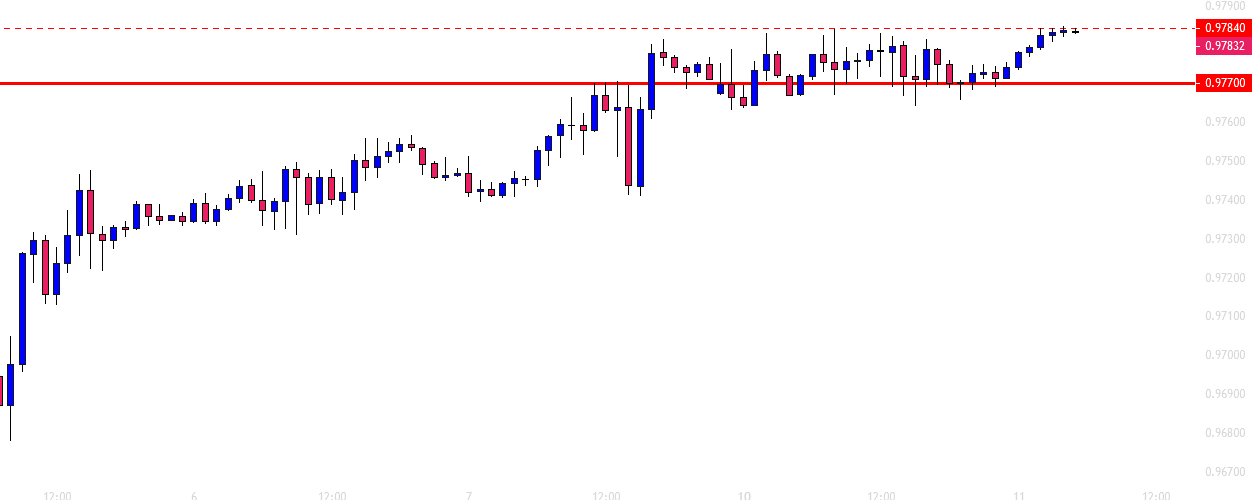
The chart shows that the price has been bullish for the last six candles. However, it has been sluggish. The last bullish wave suggests that it may consolidate more within the levels of 0.97840 to 0.97700. If the price makes a breakout at the level of resistance, it may find its next resistance at the level of 0.98000. On the other hand, in case of a bearish breakout, it may find its next support at the level of 0.97420.
The H1 chart looks neutral, but the daily and the H4 chart look very bullish. A strong breakout at the swing high may push the price towards the North with good bullish momentum. Eventually, it may go up to the magic round number of 1.00000.
Author

EagleFX Team
EagleFX
EagleFX Team is an international group of market analysts with skills in fundamental and technical analysis, applying several methods to assess the state and likelihood of price movements on Forex, Commodities, Indices, Metals and


