In our previous analysis GBPUSD: Upwards Correction vs. Downtrend Reversal ! Cable unfolded exactly as expected with first target reached and exceeded and Cable fell short of the second target -at 1.4640- by less than one pip before reversing directions.
To answer today`s question "Is Cable`s uptrend exhausted yet ?", we should delve deeper into both main and alternate charts. In a nutshell, the main count allows for one more push upwards to complete the corrective pattern while the alternate count expects that Cable`s uptrend is mature and that Cable is within its early stages within a downwards impulse.
As always we will wait for either counts confirmation point to be reached to determine the highly probable count.
Main Count
- Invalidation Point: 1.5932 -- 1.4322
- Upwards Targets: 1.4670 -- 1.4683
- Wave number: (c) green
- Wave structure: Motive
- Wave pattern: ُImpulse/Ending diagonal
Alternate Count
- Invalidation Point: 1.4640
- Confirmation Point: 1.4004 -- 1.3835
- Downwards Target: 1.3591
- Wave number: 3 blue
- Wave structure: Motive
- Wave pattern: ُImpulse
Big Picture
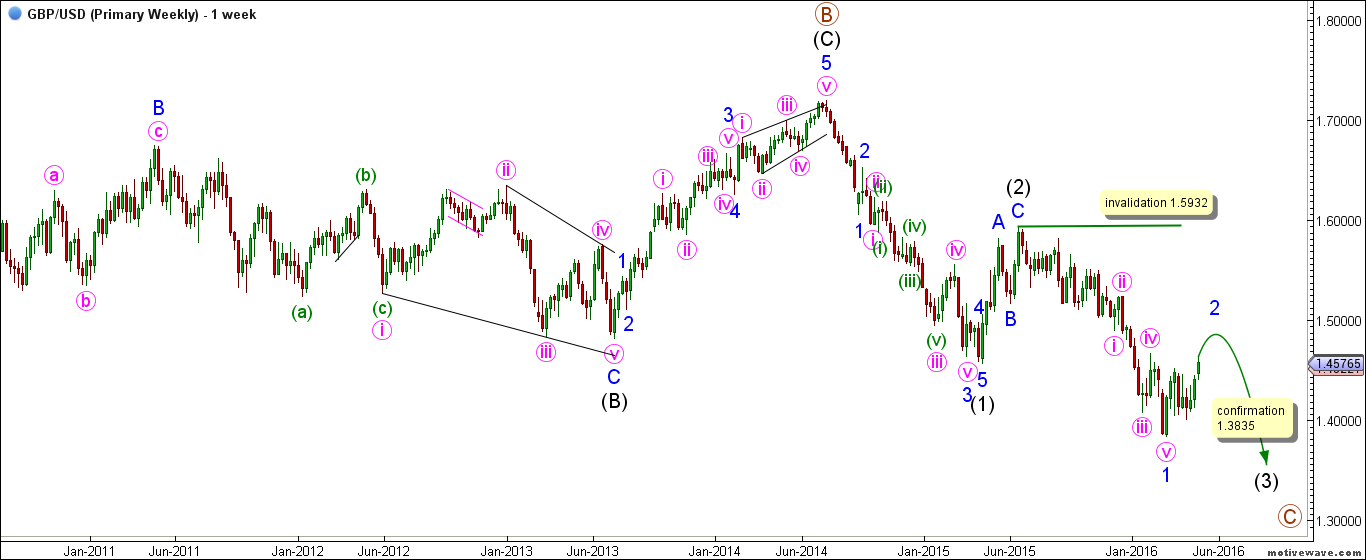
The weekly chart suggests that wave C maroon is unfolding downwards as an impulse with waves (1) and (2) black complete and wave (3) black is extending downwards.
Within wave (3) black, it is expected that wave 1 blue is complete and that wave 2 blue is unfolding upwards in a corrective manner.
It would be confirmed that wave 3 blue is underway by movement below 1.3835.
Main Wave Count
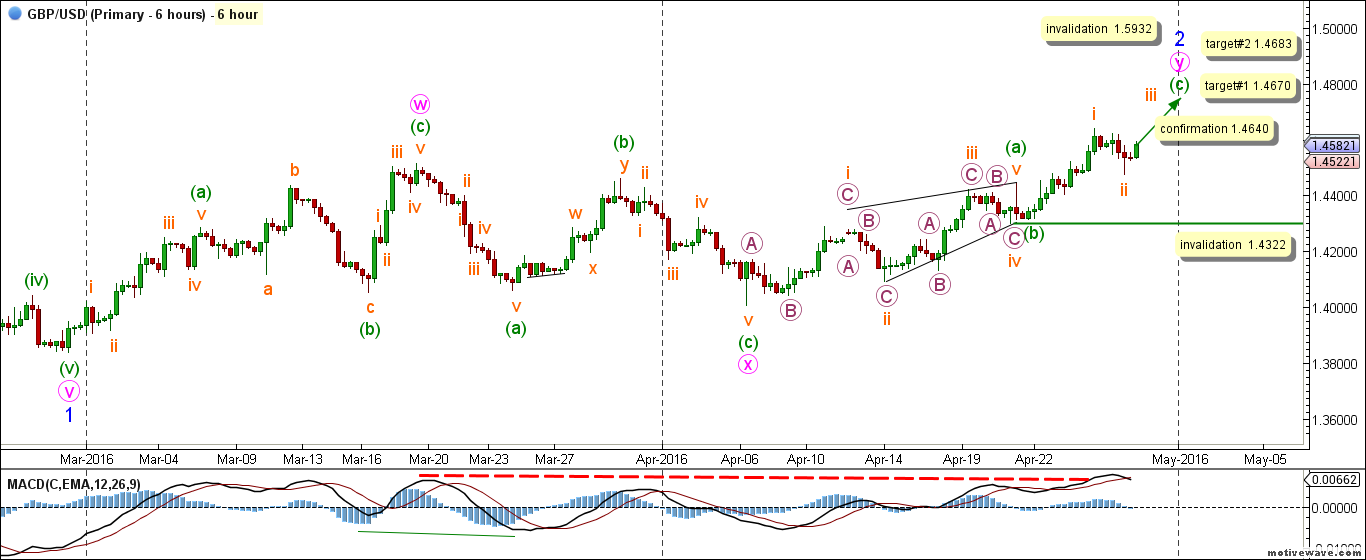
This count expects that wave 1 blue is complete as an impulse labeled waves i through v pink with wave v pink unfolding as an impulse labeled waves (i) through (v) green.
Within minor wave 2 blue, waves w and x pink are complete and that wave y pink has started unfolding upwards.
Wave w pink unfolded as a zigzag labeled waves (a), (b) and (c) green.
Wave (a) green unfolded as an impulse labeled waves i through v orange.
Wave (b) green unfolded as an expanded flat correction labeled waves a, b and c orange with wave b orange unfolding as a zigzag labeled waves A, B and C purple.
After the completion of wave (b) green, wave (c) green unfolded as an impulse labeled waves i through v orange.
Wave x pink unfolded as a zigzag labeled waves (a), (b) and (c) green.
Wave (a) green unfolded as an impulse labeled waves i through v orange.
Wave (c) green unfolded as an impulse labeled waves i through v orange.
Within wave y pink, waves (a) and (b) green are complete and that wave (c) green is underway.
Within wave (c) green it is likely that waves i and ii orange are complete and that wave iii orange has started unfolding upwards.
This count would be confirmed by movement above 1.4640.
At 1.4670 wave iii orange would reach 0.618 of wave i orange and at 1.4683 wave y pink would reach equality with wave w pink.
This count would be invalidated by movement below 1.4322 as wave ii orange may not retrace more than 100 % of wave i orange and it should be noted that the invalidation point would be moved to the end of wave ii orange once we have confirmation on the hourly chart that wave iii orange is underway. As well this count would be invalidated by movement above 1.5932 as wave 2 blue may not retrace more than 100 % of wave 1 blue.
Alternate Wave Count
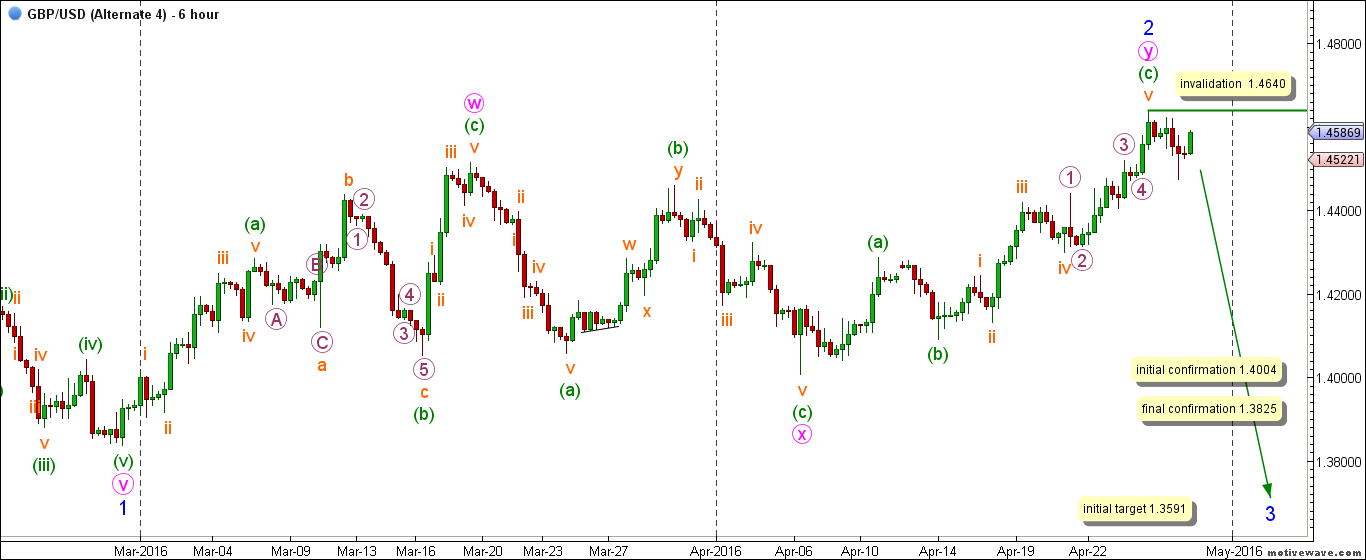
The difference between both main and alternate counts is within the subdivisions within wave y pink.
This count expects that wave y pink is complete and that wave 3 blue has started unfolding downwards.
Wave y pink unfolded as a zigzag labeled waves (a), (b) and (c) green.
Wave (a) green unfolded as a leading diagonal labeled waves i through v orange.
Wave (c) green unfolded as an impulse labeled waves i through v orange.
This count would be initially confirmed by movement below 1.4004 and the final confirmation point is at 1.3835.
A very conservative initial target for wave 3 blue is at 1.3591 as at that level wave 3 blue would reach 50 % of wave 1 blue and we will be able to refine that target once wave 3 blue starts subdividing downwards.
This count would be invalidated by movement above 1.4640 as within wave 3 blue no second wave may retrace more than 100 % of its first wave.
We may also wish to keep an eye on the daily update GBP USD Forecast.
Note: All information on this page is subject to change. The use of this website constitutes acceptance of our user agreement. Please read our privacy policy and legal disclaimer. Opinions expressed at FXstreet.com are those of the individual authors and do not necessarily represent the opinion of FXstreet.com or its management. Risk Disclosure: Trading foreign exchange on margin carries a high level of risk, and may not be suitable for all investors. The high degree of leverage can work against you as well as for you. Before deciding to invest in foreign exchange you should carefully consider your investment objectives, level of experience, and risk appetite. The possibility exists that you could sustain a loss of some or all of your initial investment and therefore you should not invest money that you cannot afford to lose. You should be aware of all the risks associated with foreign exchange trading, and seek advice from an independent financial advisor if you have any doubts.
Recommended Content
Editors’ Picks

EUR/USD stabilizes above 1.1350 on Easter Friday
EUR/USD enters a consolidation phase above 1.1350 on Friday as the trading action remains subdued, with major markets remaining closed in observance of the Easter Holiday. On Thursday, the European Central Bank (ECB) announced it cut key rates by 25 bps, as expected.

GBP/USD fluctuates below 1.3300, looks to post weekly gains
After setting a new multi-month high near 1.3300 earlier in the week, GBP/USD trades in a narrow band at around 1.32700 on Friday and remains on track to end the week in positive territory. Markets turn quiet on Friday as trading conditions thin out on Easter Holiday.

Gold ends week with impressive gains above $3,300
Gold retreated slightly from the all-time high it touched at $3,357 early Thursday but still gained more than 2% for the week after settling at $3,327. The uncertainty surrounding US-China trade relations caused markets to adopt a cautious stance, boosting safe-haven demand for Gold.

How SEC-Ripple case and ETF prospects could shape XRP’s future
Ripple consolidated above the pivotal $2.00 level while trading at $2.05 at the time of writing on Friday, reflecting neutral sentiment across the crypto market.

Future-proofing portfolios: A playbook for tariff and recession risks
It does seem like we will be talking tariffs for a while. And if tariffs stay — in some shape or form — even after negotiations, we’ll likely be talking about recession too. Higher input costs, persistent inflation, and tighter monetary policy are already weighing on global growth.

The Best brokers to trade EUR/USD
SPONSORED Discover the top brokers for trading EUR/USD in 2025. Our list features brokers with competitive spreads, fast execution, and powerful platforms. Whether you're a beginner or an expert, find the right partner to navigate the dynamic Forex market.


