![]() Tamer Elzein
Tamer Elzein
Independent Analyst
It was an interesting week that ended pretty much in a stalemate. Price first rallied for a few day to test the 61.8% retracement level of the most recent decline, and it repeatedly failed to close above it. This led to a strong rebound towards the downside where the market made a new low, but just barely.
Right now our reasons for favoring the bearish view haven’t changed and are still as strong as they were last week. However, any impulsive rally at this point will provide compelling reason for abandoning our medium-term bearish view and moving to our alternate daily count.
We’re updating our counts to reflect the most recent price action and to present tighter targets and invalidation points.
Weekly Main Count
– Invalidation Point: 1.1465 – 1.0525
– Confirmation Point: –
– Downwards Target: 1.0885 – 1.0727
– Wave number: Minor D
– Wave structure: Corrective
– Wave pattern: Zigzag
Weekly Alternate Count
– Invalidation Point: 1.1718 – 1.0821
– Confirmation Point: 1.1465
– Upwards Target: 1.1616 – 1.1673
– Wave number: Minor C
– Wave structure: Corrective
– Wave pattern: Double Zigzag
Big Picture
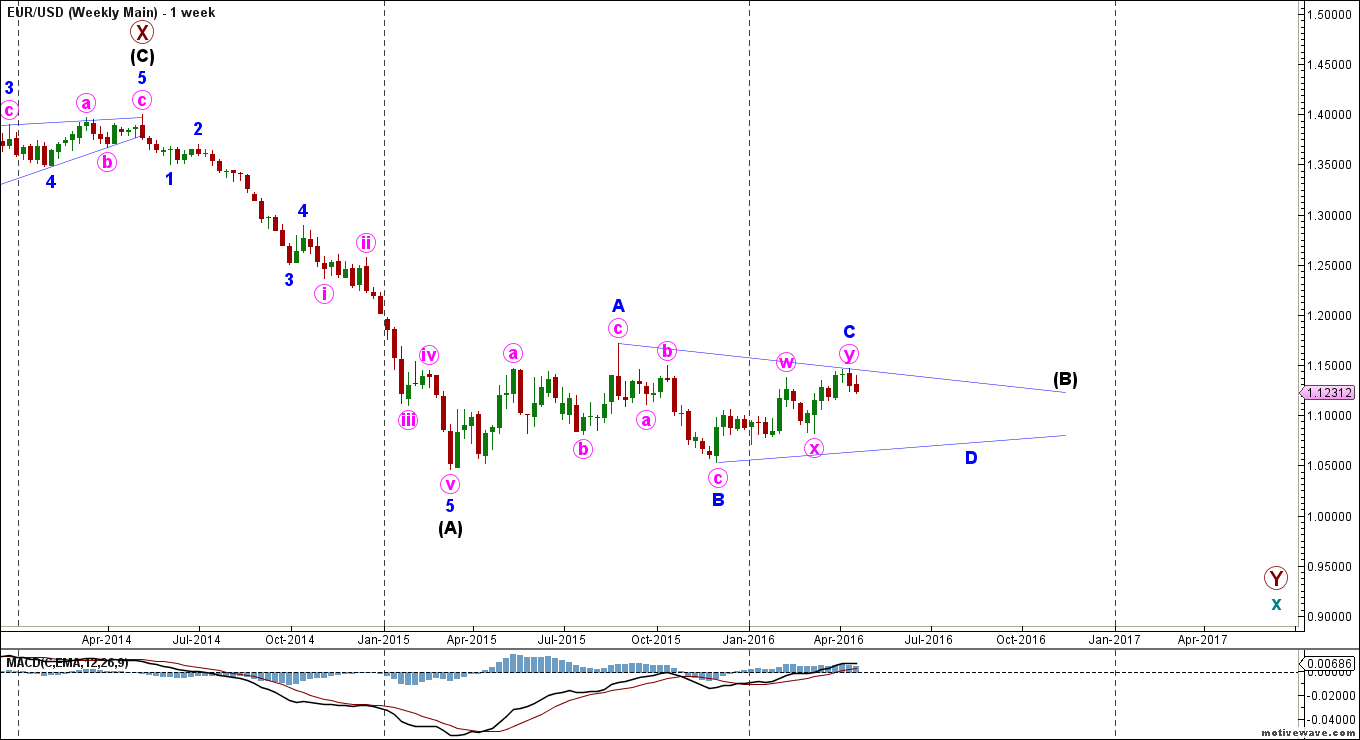
The bigger picture sees that the euro is moving towards the downside in teal wave x, which is forming a double zigzag labeled maroon waves W, X and Y.
Maroon wave Y is forming a zigzag labeled black waves (A), (B) and (C).
Black wave (A) formed an impulse labeled blue waves 1 through 5.
Black wave (B) is forming a contracting triangle labeled blue waves A through E.
Main Weekly Wave Count
_20160425224435.png)
This main count sees that blue wave C formed a double zigzag labeled pink waves w, x and y. It retraced exactly 78.6% of blue wave B.
Within it, pink wave y formed a zigzag labeled green waves (a), (b) and (c).
This count expects the euro to move towards the downside in blue wave D, which is likely forming a zigzag labeled pink waves a, b and c.
The MACD indicator supports this count by showing a clear bearish divergence between the highs of pink waves w and y, as well as a bearish crossover.
At 1.0886 blue wave D would retrace 61.8% of blue wave C, then at 1.0727 it would reach 61.8% the length of blue wave B.
This wave count is invalidated by movement above 1.1465 as pink wave b of this zigzag may not move beyond the start of pink wave a. It’s also invalidated by movement below 1.0525 as blue wave D may not move beyond the start of blue wave C.
Alternate Weekly Wave Count
_20160425224451.png)
This alternate daily count sees that pink wave y of blue wave C is still unfolding as a zigzag labeled green waves (a), (b) and (c).
Within it, green wave (a) formed a leading diagonal labeled orange waves i through v.
Green wave (b) formed a zigzag labeled orange waves a, b and c, retracing exactly 38.2% of green wave (a) so far. It’s likely complete or near completion.
This count expects the euro to resume move towards the upside in green wave (c), to complete pink y, and therefore blue wave C. This will be confirmed by movement above 1.1465.
At 1.1616 green wave (c) would reach 61.8% the length of green wave (a), then at 1.1673 pink wave y would reach 100% the length of pink wave w.
This wave count is invalidated by movement above 1.1718 as blue wave C of this contracting triangle may not move beyond the start of blue wave B. It’s also invalidated by movement below 1.0821 as green wave (b) of this zigzag may not move beyond the start of green wave (a).
Note: All information on this page is subject to change. The use of this website constitutes acceptance of our user agreement. Please read our privacy policy and legal disclaimer. Opinions expressed at FXstreet.com are those of the individual authors and do not necessarily represent the opinion of FXstreet.com or its management. Risk Disclosure: Trading foreign exchange on margin carries a high level of risk, and may not be suitable for all investors. The high degree of leverage can work against you as well as for you. Before deciding to invest in foreign exchange you should carefully consider your investment objectives, level of experience, and risk appetite. The possibility exists that you could sustain a loss of some or all of your initial investment and therefore you should not invest money that you cannot afford to lose. You should be aware of all the risks associated with foreign exchange trading, and seek advice from an independent financial advisor if you have any doubts.
Recommended Content
Editors’ Picks

EUR/USD accelerates losses to 1.0930 on stronger Dollar
The US Dollar's recovery regains extra impulse sending the US Dollar Index to fresh highs and relegating EUR/USD to navigate the area of daily troughs around 1.0930 in the latter part of Friday's session.

GBP/USD plummets to four-week lows near 1.2850
The US Dollar's rebound keep gathering steam and now sends GBP/USD to the area of multi-week lows in the 1.2850 region amid the broad-based pullback in the risk-associated universe.

Gold trades on the back foot, flirts with $3,000
Gold prices are accelerating their daily decline, steadily approaching the critical $3,000 per troy ounce mark as the Greenback's rebound gains extra momentum and US yields tighten their retracement.

Can Maker break $1,450 hurdle as whales launch buying spree?
Maker holds steadily above $1,250 support as a whale scoops $1.21 million worth of MKR. Addresses with a 100k to 1 million MKR balance now account for 24.27% of Maker’s total supply. Maker battles a bear flag pattern as bulls gather for an epic weekend move.

Strategic implications of “Liberation Day”
Liberation Day in the United States came with extremely protectionist and inward-looking tariff policy aimed at just about all U.S. trading partners. In this report, we outline some of the more strategic implications of Liberation Day and developments we will be paying close attention to going forward.

The Best brokers to trade EUR/USD
SPONSORED Discover the top brokers for trading EUR/USD in 2025. Our list features brokers with competitive spreads, fast execution, and powerful platforms. Whether you're a beginner or an expert, find the right partner to navigate the dynamic Forex market.