As we move closer to Thursday's historic referendum in the UK, so-called Brexit, that would decide the fate of its membership in the European Union, most investors are seen struggling with the question that how will markets react to the outcome. Markets have already been seesawing amid high volatility with changing sentiment on various poll results that still suggests a tight battle between the 'Leave' and 'Remain' camps. The GBP/USD pair, which best reflects investor sentiment, has been exclusively driven by developments surrounding the crucial event.
I have tried to lay down some important technical levels / formations for the GBP/USD pair for both the possible outcomes; i.e. in the event voters favor a Brexit or if they support to remain with the EU, or Bremain.
Brexit – Bearish scenario
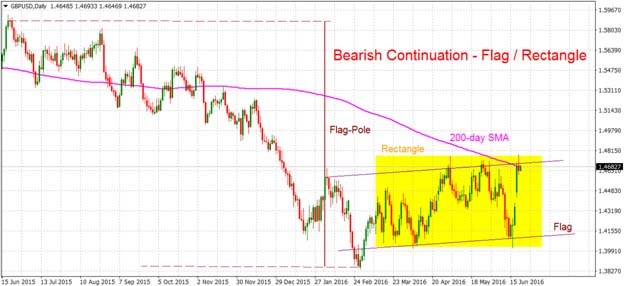
Except for a sharp slide in late Feb., the pair has been oscillating within an equidistance ascending trend-channel, with the trend-channel resistance coinciding with 200-day SMA around 1.4700-20 region. The ascending channel when considered in conjunction with the pair's sharp slide from 2015 highs seems to be forming a continuation chart pattern, Flag, marking a consolidation phase before the pair resumes its previous weakening trend. However, since the range-bound movement is more than 12 weeks old, it could also be classified as a rectangle, which again is a continuation pattern that points to a pause in the medium-longer term downtrend. However, the bearish continuation pattern would be confirmed only when the pair decisively breaks below 1.4000 important support.
Levels to watch
If there is a vote to leave the EU, the GBP/USD pair could immediately slump below the 1.4000 important support and should continue weakening over the next few weeks and months. A confirmation of the break-down below 1.4000 handle, would accelerate the slide and immediately expose 2016 lows support near 1.3850-40 region. A follow through selling pressure has the potential to continue dragging the pair further towards 2009 swing lows support around 1.3500 region, with some intermediate support around 1.3680-75 region.
The pair could be expected to witness an unprecedented fall to 1.3300 (estimated decline post rectangular formation break-down) and possibly till 1.2300 level, expected price target of the bearish flag chart-pattern.

Bremain – Bullish argument
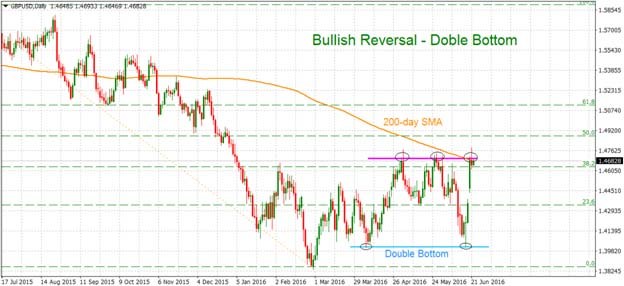
Going into the big event, the GBP/USD pair has already witnessed a sharp run-up of nearly 700-pips from the vicinity of 1.4000 handle and traded above 200-day SMA for the first time since Nov. 2015, virtually pricing-in a win for the 'Remain' campaign. Last week's bounce-off 1.4000 psychological mark constituted towards formation of a bullish reversal, double-bottom chart pattern. However, the pair has repeatedly failed to sustain its strength above 1.4700 handle but attempted to conquer 200-day SMA, which would reinforce medium-term bullish momentum. Hence, a convincing break above 1.4700 (200-day SMA region) would confirm the bullish chart pattern and pave way for further appreciating move for the pair.
Levels to watch
Bulls should wait for a sustained momentum above 1.4750, above which the pair is likely to immediately gap higher to 1.4880-1.4900 resistance, marking 50% Fibonacci retracement level of 1.5930-1.3838 downfall. The momentum should further get extended, beyond 1.5000 psychological mark resistance, towards 61.8% Fibonacci retracement level resistance near 1.5100 area. Eventually the pair could rise back to its next major psychological mark resistance around 1.5500 handle, also coinciding with the estimated price target of the bullish double-bottom chart pattern.

Information on these pages contains forward-looking statements that involve risks and uncertainties. Markets and instruments profiled on this page are for informational purposes only and should not in any way come across as a recommendation to buy or sell in these assets. You should do your own thorough research before making any investment decisions. FXStreet does not in any way guarantee that this information is free from mistakes, errors, or material misstatements. It also does not guarantee that this information is of a timely nature. Investing in Open Markets involves a great deal of risk, including the loss of all or a portion of your investment, as well as emotional distress. All risks, losses and costs associated with investing, including total loss of principal, are your responsibility. The views and opinions expressed in this article are those of the authors and do not necessarily reflect the official policy or position of FXStreet nor its advertisers. The author will not be held responsible for information that is found at the end of links posted on this page.
If not otherwise explicitly mentioned in the body of the article, at the time of writing, the author has no position in any stock mentioned in this article and no business relationship with any company mentioned. The author has not received compensation for writing this article, other than from FXStreet.
FXStreet and the author do not provide personalized recommendations. The author makes no representations as to the accuracy, completeness, or suitability of this information. FXStreet and the author will not be liable for any errors, omissions or any losses, injuries or damages arising from this information and its display or use. Errors and omissions excepted.
The author and FXStreet are not registered investment advisors and nothing in this article is intended to be investment advice.
Recommended Content
Editors’ Picks

EUR/USD erases gains to trade near 1.1050 ahead of US NFP, Powell
EUR/USD has erased gains to trade neutral near 1.1050 in the European session on Friday. The US Dollar breathes a sigh of relief after the trade war and recession fears-led sell-off, weighing on the pair. Traders look to the US NFP report and Fed Chair Powell's speech for fresh directives.

GBP/USD returns to the red near 1.3050 as US NFP data looms
GBP/USD is under heavy selling pressure near 1.3050 in European trading on Friday. Traders resort to profit-taking on their US Dollar short positiions, adjusting ahead of the critical US Nonfarm Payrolls data and Fed Chair Powell speech.

Gold price sticks to negative bias around $3,100; bears seem non-committed ahead of US NFP report
Gold price meets with a fresh supply on Friday, though the downside potential seems limited. Trump’s tariffs-inspired risk-off mood might continue to act as a tailwind for the precious metal. Fed rate cut bets weigh on the USD and also contribute to limiting losses for the XAU/USD pair.

XRP finds new lifeline as Coinbase Derivatives eyes XRP futures on April 21
Ripple price reclaims the $2.00 support level and trades at $2.06 at the time of writing on Friday in the wake of a drawdown to $1.96 during Thursday’s session. Traders continue to exercise caution after Trump’s tariffs hit 100 countries, as per a CryptoQuant report.

Trump’s “Liberation Day” tariffs on the way
United States (US) President Donald Trump’s self-styled “Liberation Day” has finally arrived. After four straight failures to kick off Donald Trump’s “day one” tariffs that were supposed to be implemented when President Trump assumed office 72 days ago, Trump’s team is slated to finally unveil a sweeping, lopsided package of “reciprocal” tariffs.

The Best brokers to trade EUR/USD
SPONSORED Discover the top brokers for trading EUR/USD in 2025. Our list features brokers with competitive spreads, fast execution, and powerful platforms. Whether you're a beginner or an expert, find the right partner to navigate the dynamic Forex market.