Gold surges as US Dollar Index faces sharp decline: Key technical levels and market forces in focus
-
DXY plummeted over 3% in March, down 6% from January highs, and tested critical support at 103.25.
-
Gold rebounds from key support, eyes $3,000 as economic pressures mount.
-
US tariff policies and shifting market sentiment are fundamental to gold's rally.
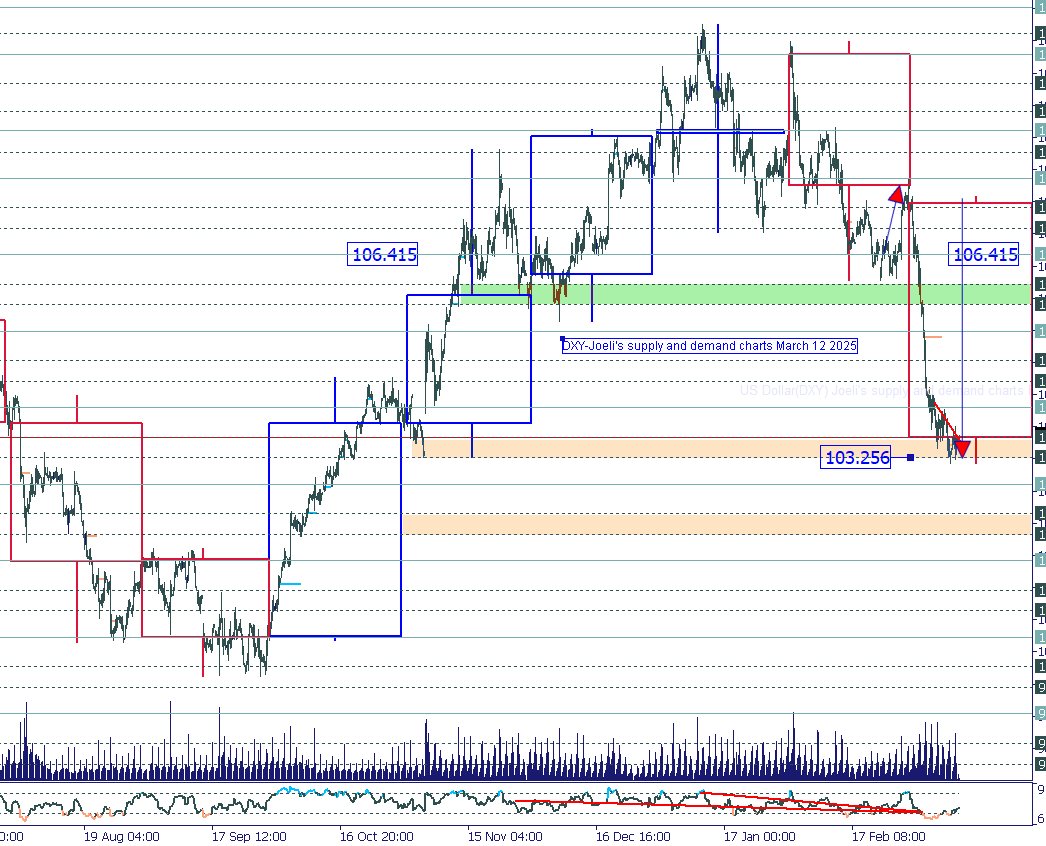
US Dollar Analysis: The US Dollar Index (DXY) has suffered its steepest monthly decline since November 2023, dropping over 3% in the first two weeks of March and now sitting more than 6% below its January 2025 highs. As anticipated in the previous analysis, the DXY failed to break through the 107.60 critical resistance zone at the end of February. This rejection triggered a sharp price breakdown at the beginning of March, slicing through major intra-day and monthly support levels.
Currently, the DXY is testing support at 103.25, providing a temporary reprieve for sellers to take profit. If this level holds, buyers may eye targets at 104.00, 104.45, 104.77, and 105.22. Conversely, failure to maintain this support could renew bearish momentum, pushing the Index toward 102.84, 102.40, and possibly 102.00.
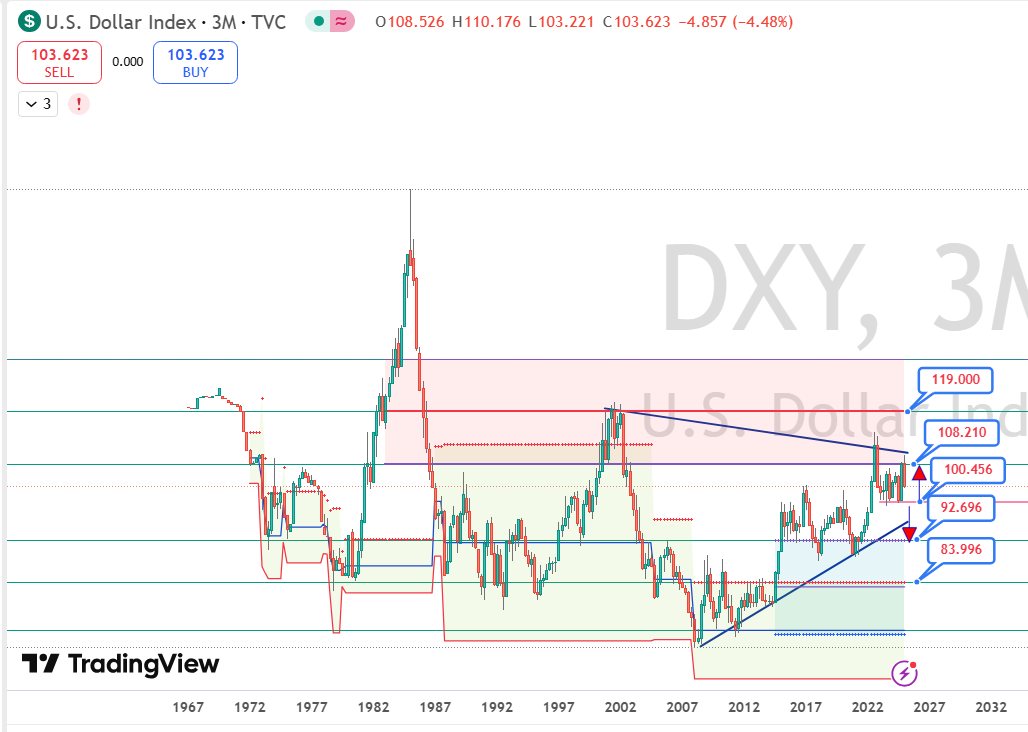
The long-term three-month candle chart reveals a symmetric triangle formation. A critical breakdown occurred at the top of the triangle in October 2022, below the 108.21 support line. The January 2025 drop raises further concerns about the dollar's future strength. A decisive break below the psychological 100.00 mark could trigger a prolonged downturn, with the next major support around 92.70. Should the dollar hold above 100.00, a retest of 108.21 remains plausible.
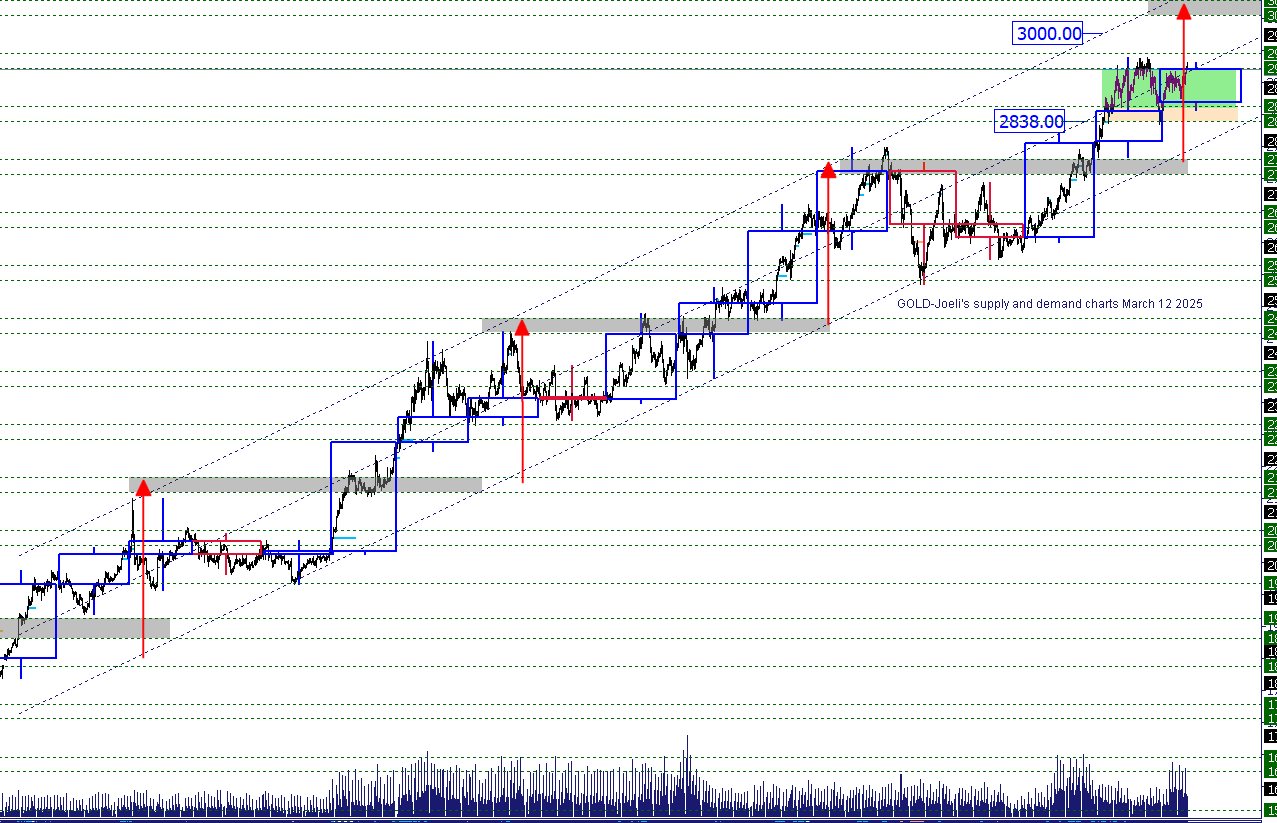
Gold's Resurgence: As highlighted in the February 28 analysis, gold has climbed back to the $2,936 resistance zone after bouncing off its $2,838 critical support. The inverse correlation between gold and the dollar played out early in March, with the DXY plunging below 106.41 while gold rebounded off $2,838 to its current level. Long-term targets for gold remain at $3,000, $3,034, and $3,062, supported by supply and demand dynamics, long-term trends, and price cycle observations.
Fundamental Factors: The dollar faces mounting pressure due to shifting US trade policies and rising global economic uncertainty. The ongoing US tariff war has significantly impacted the dollar, gold, and equity markets. If the US administration continues on its current path, these pressures could intensify, pushing investors toward safe-haven assets like gold. Additionally, slowing economic growth and expectations of Federal Reserve rate cuts are further weighing on the greenback.
In contrast, gold's allure as a hedge against geopolitical uncertainty and currency weakness has strengthened. Rising global tensions and concerns about the persistence of inflation make precious metals increasingly attractive for portfolio diversification.
Conclusion: The US Dollar Index's inability to hold key levels has left it vulnerable to further declines, while gold's technical setup and fundamental tailwinds support a bullish outlook. A continued breakdown in the dollar could allow gold to breach the $3,000 mark in the coming weeks.
Author

Denis Joeli Fatiaki
Independent Analyst
Denis Joeli Fatiaki possesses over a decade of extensive experience as a multi-asset trader and Market Strategist.


