Global equity indexes show interesting AB=CD technical confluence

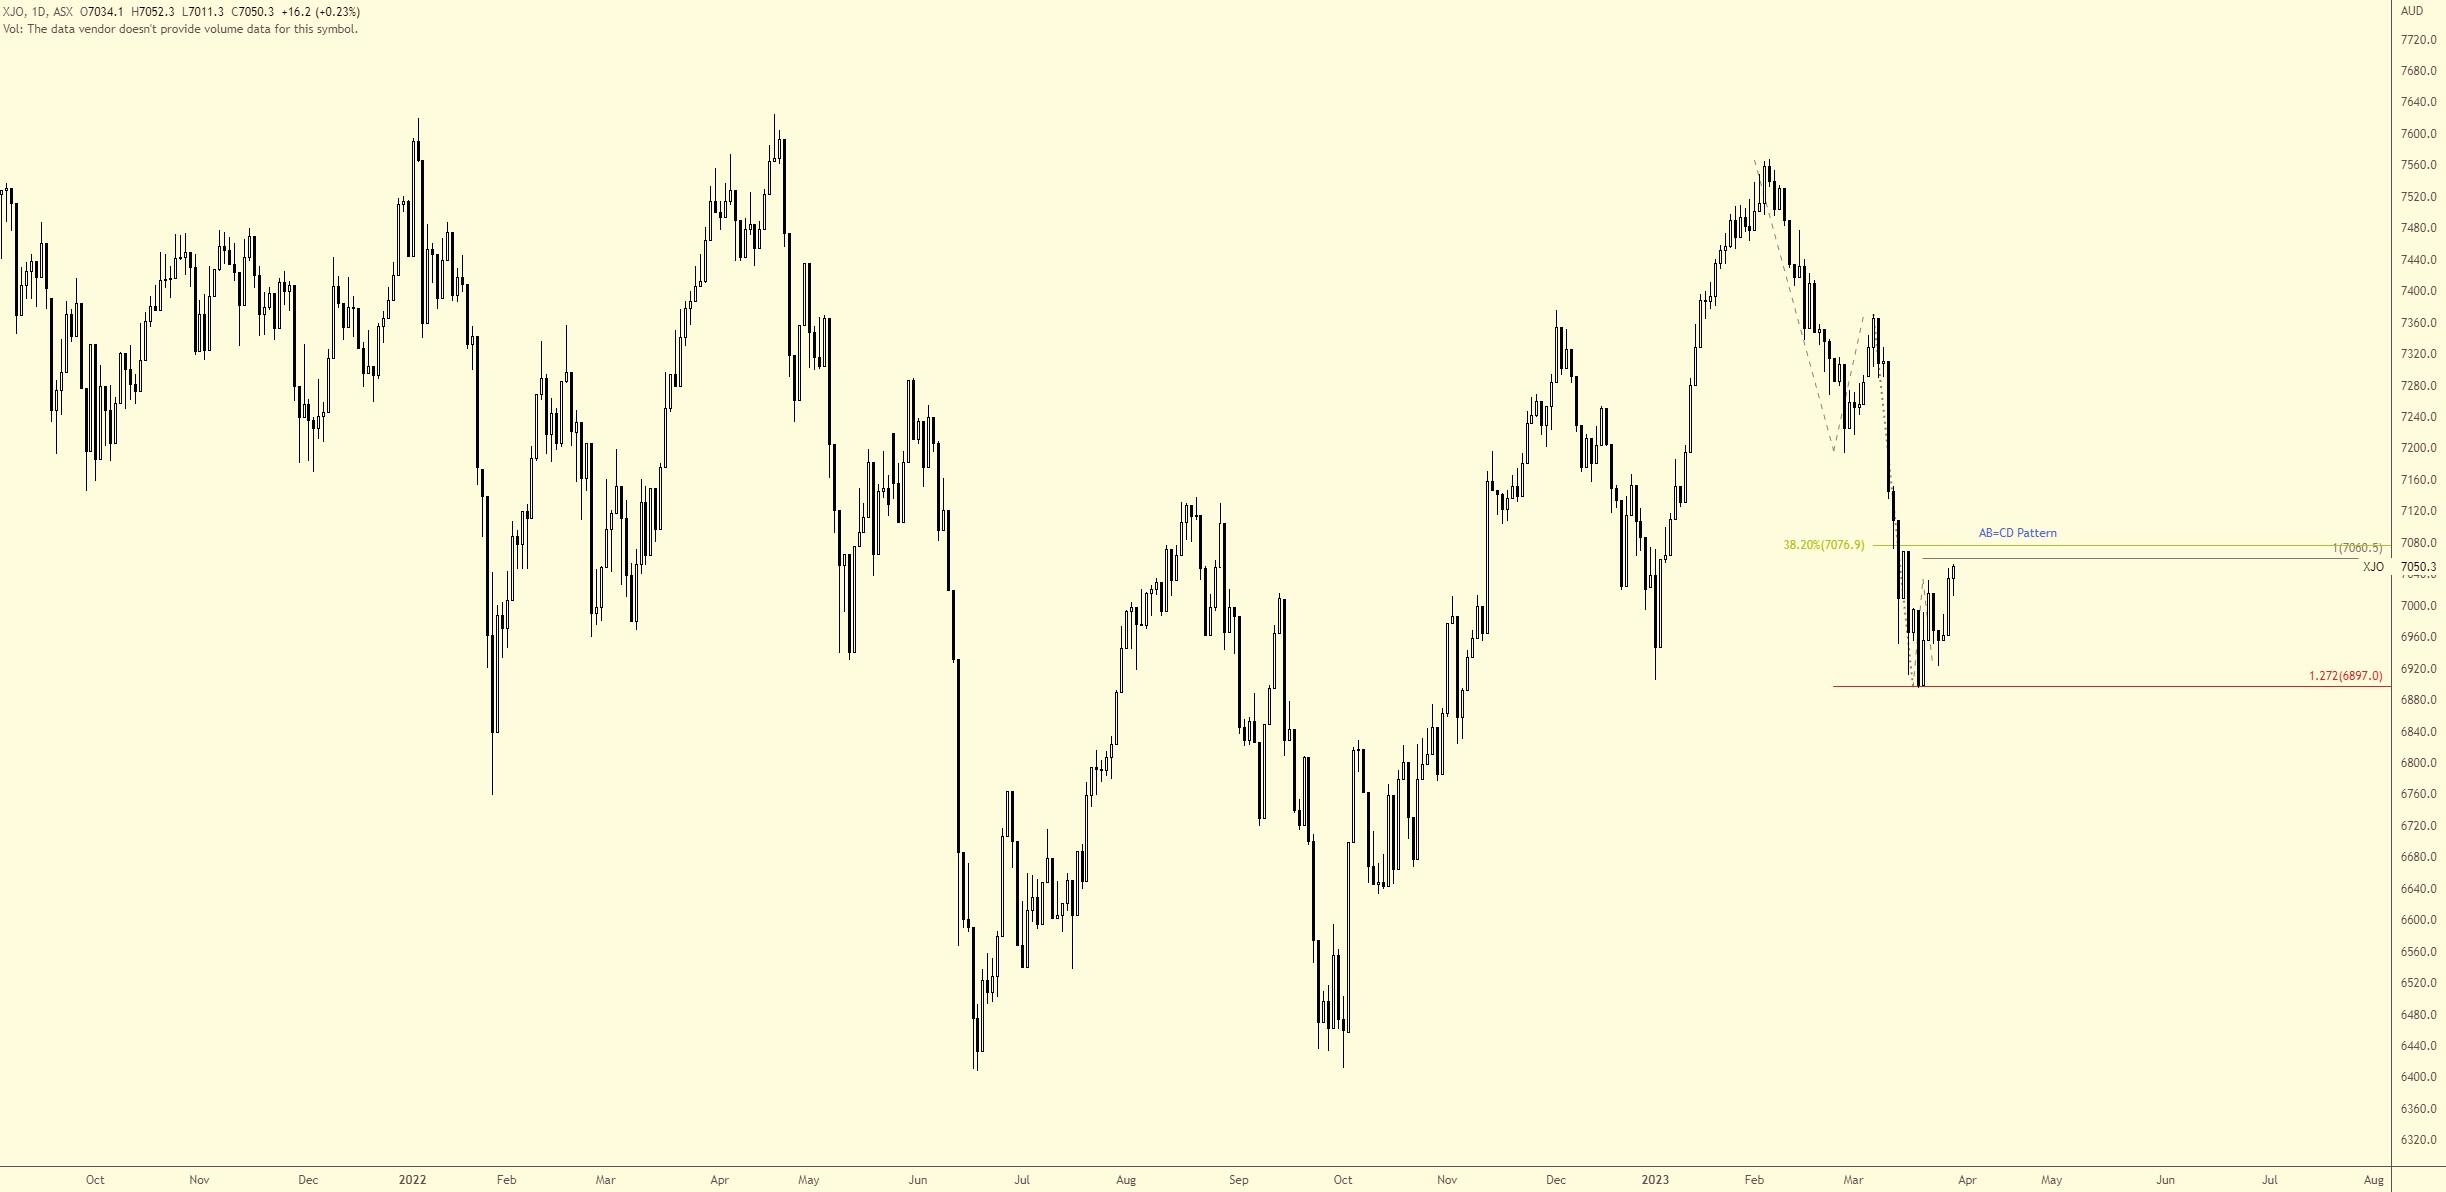
ASX 200 (XJO)
I highlighted this market in our recent Chart of the Day on the daily timeframe.
Following the lower low formed at 6,895 last week, which happened to probe below the 6,905 3 January low and touch gloves with a 1.272% Fibonacci projection at 6,897 (‘alternate’ AB=CD structure), the unit has been busy carving out an AB=CD bearish formation that will complete around the 100% projection at 7,061 should another push to the upside emerge. Nearby, I also see a 38.2% Fibonacci retracement ratio at 7,077; therefore, sellers could welcome this zone.
US and European equities showing similar AB=CD construction
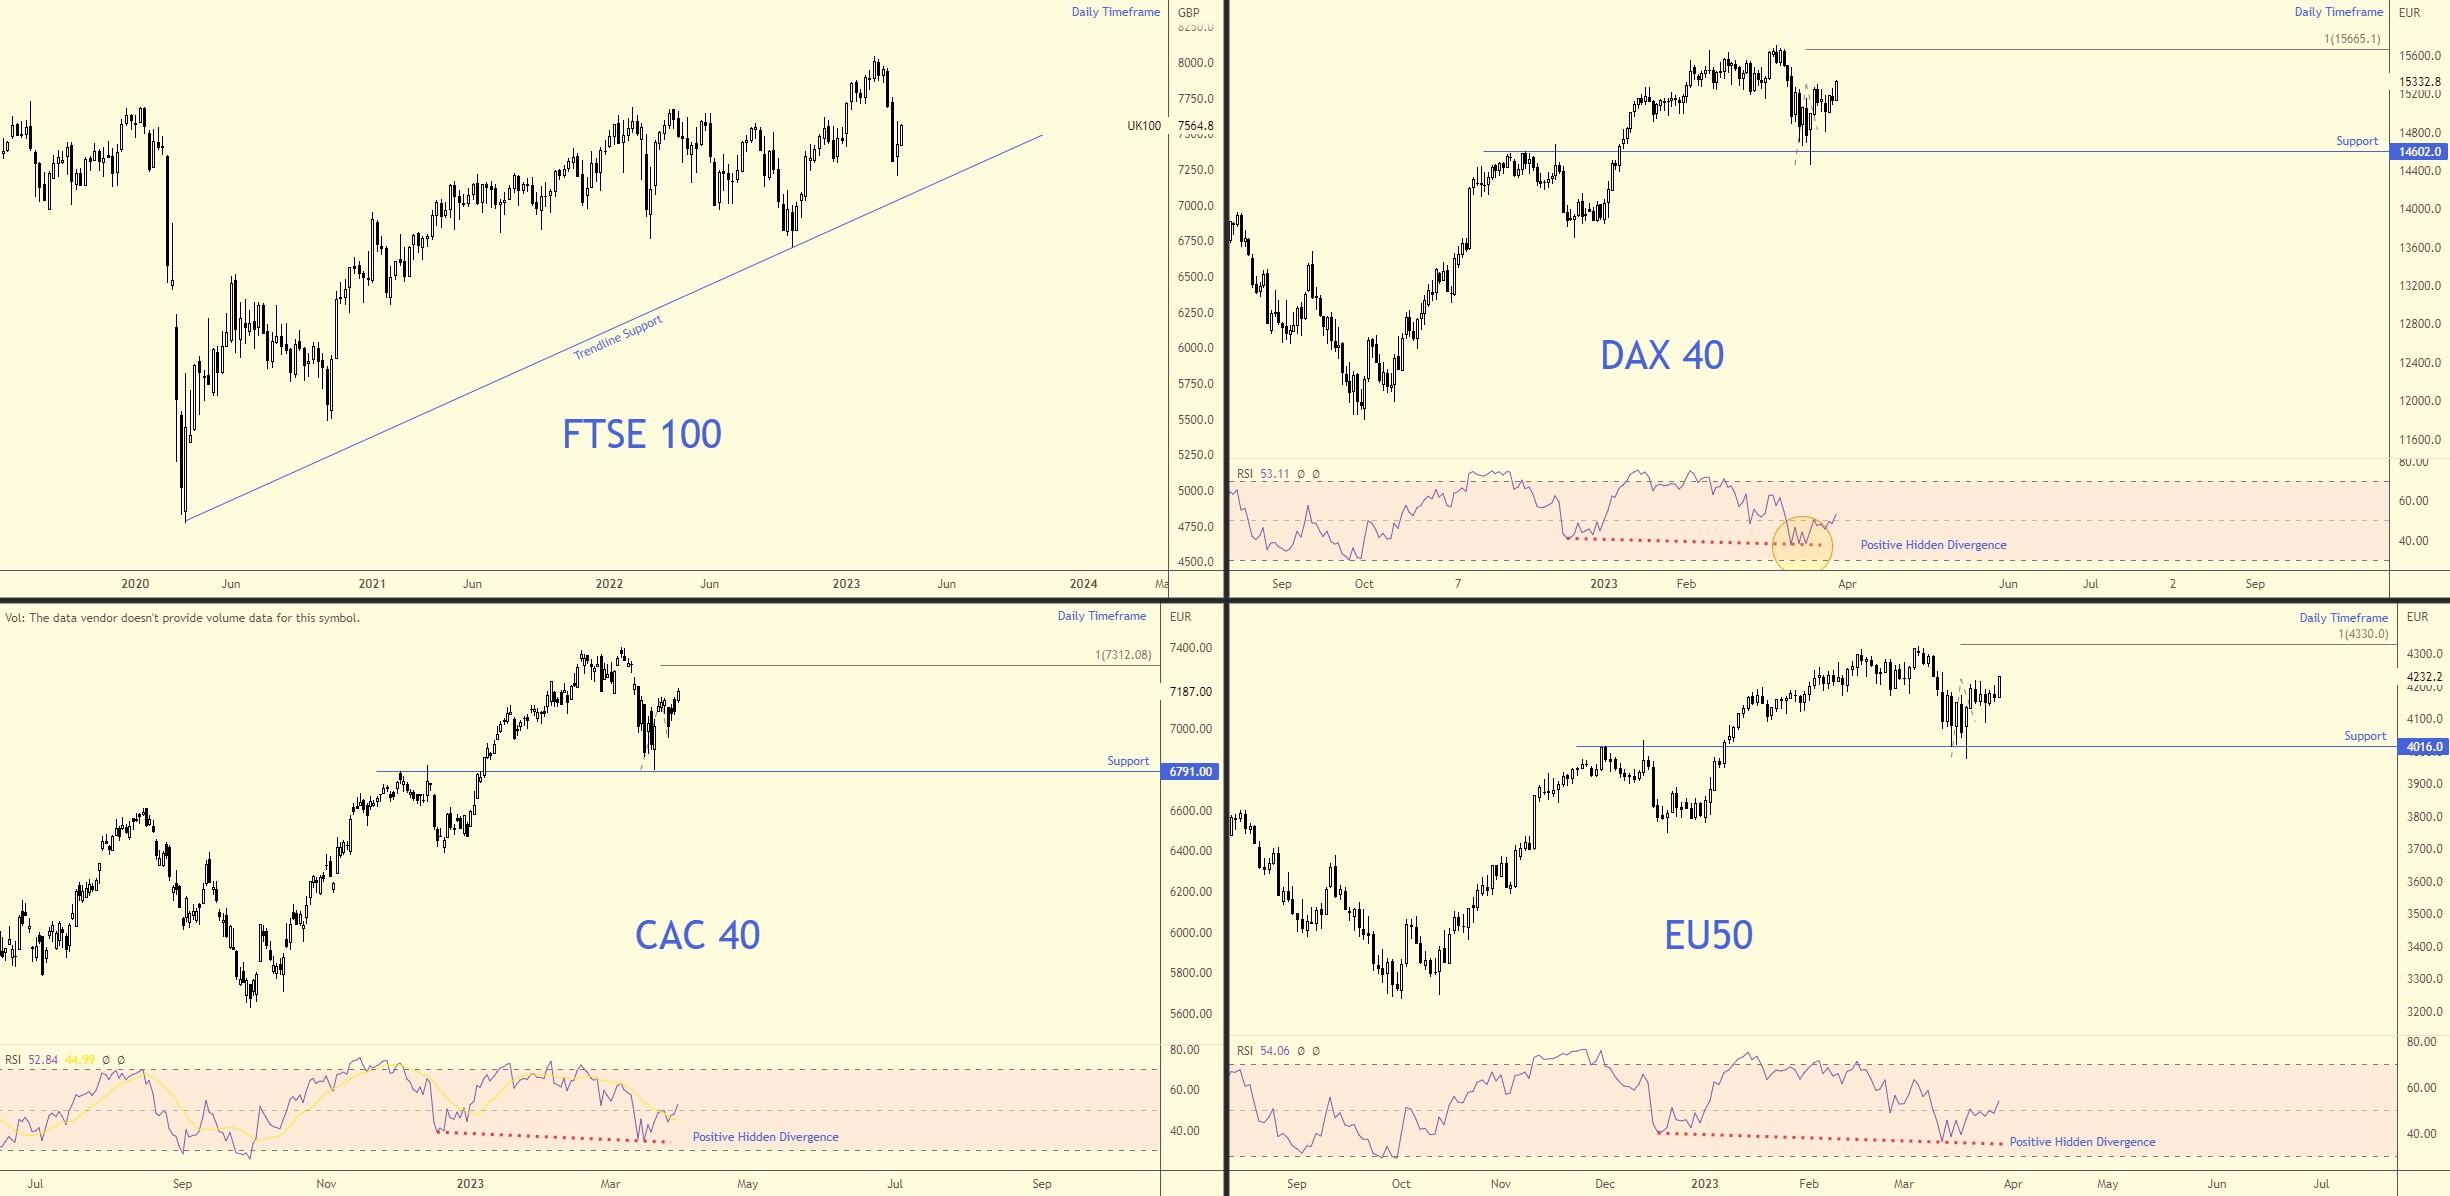
Aside from the FTSE 100, the DAX, the CAC and the EuroStoxx50 recently pencilled in a rebound from daily supports at 14,602, 6,791 and 4,016, respectively. What’s also technically appealing is that all three markets are currently printing similar price action to the ASX 200: AB=CD bearish patterns (100% projections) at 15,665, 7,312 and 4,330, respectively.
The difference, of course, is that the ASX 200 is (technically) exhibiting early signs of a downtrend, while European markets are evidently trending higher across the board.
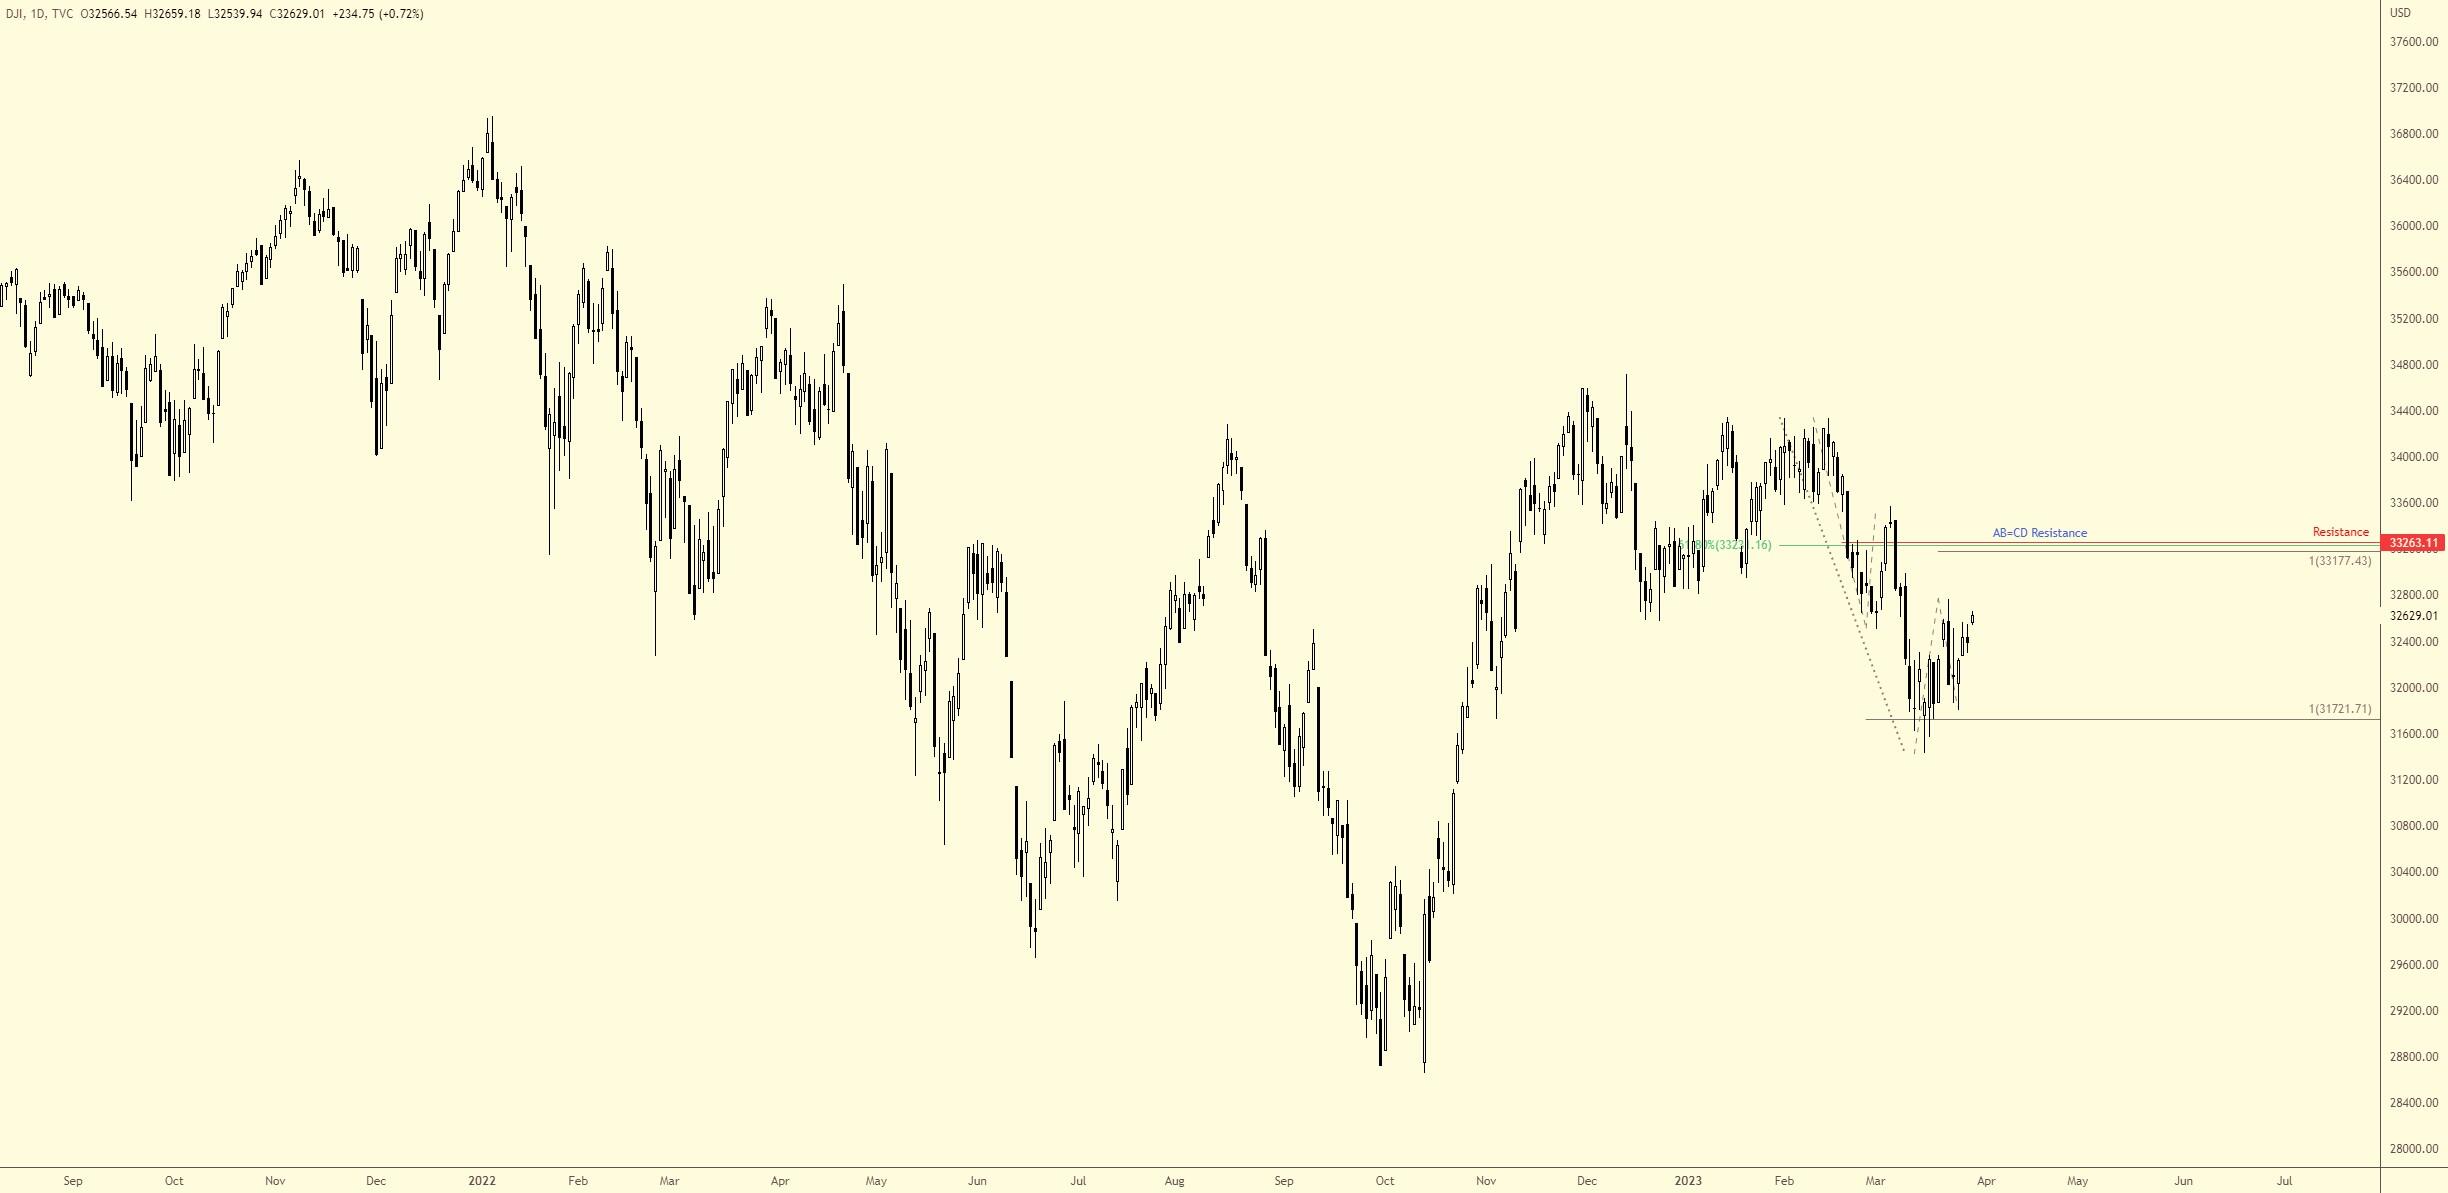
Across the pond, the S&P 500 and the DOW display similar price action on the daily timeframes.
The DOW, following its rebound from a 100% projection (AB=CD construction) at 31,721 in mid-March, is seen forming an AB=CD bearish pattern (100% projection at 33,177) in a market emphasising a downside bias (note the clear lower lows and highs since price topped in late 2022), which happens to be joined by a 61.8% Fibonacci retracement ratio at 33,234 and resistance from 33,263.
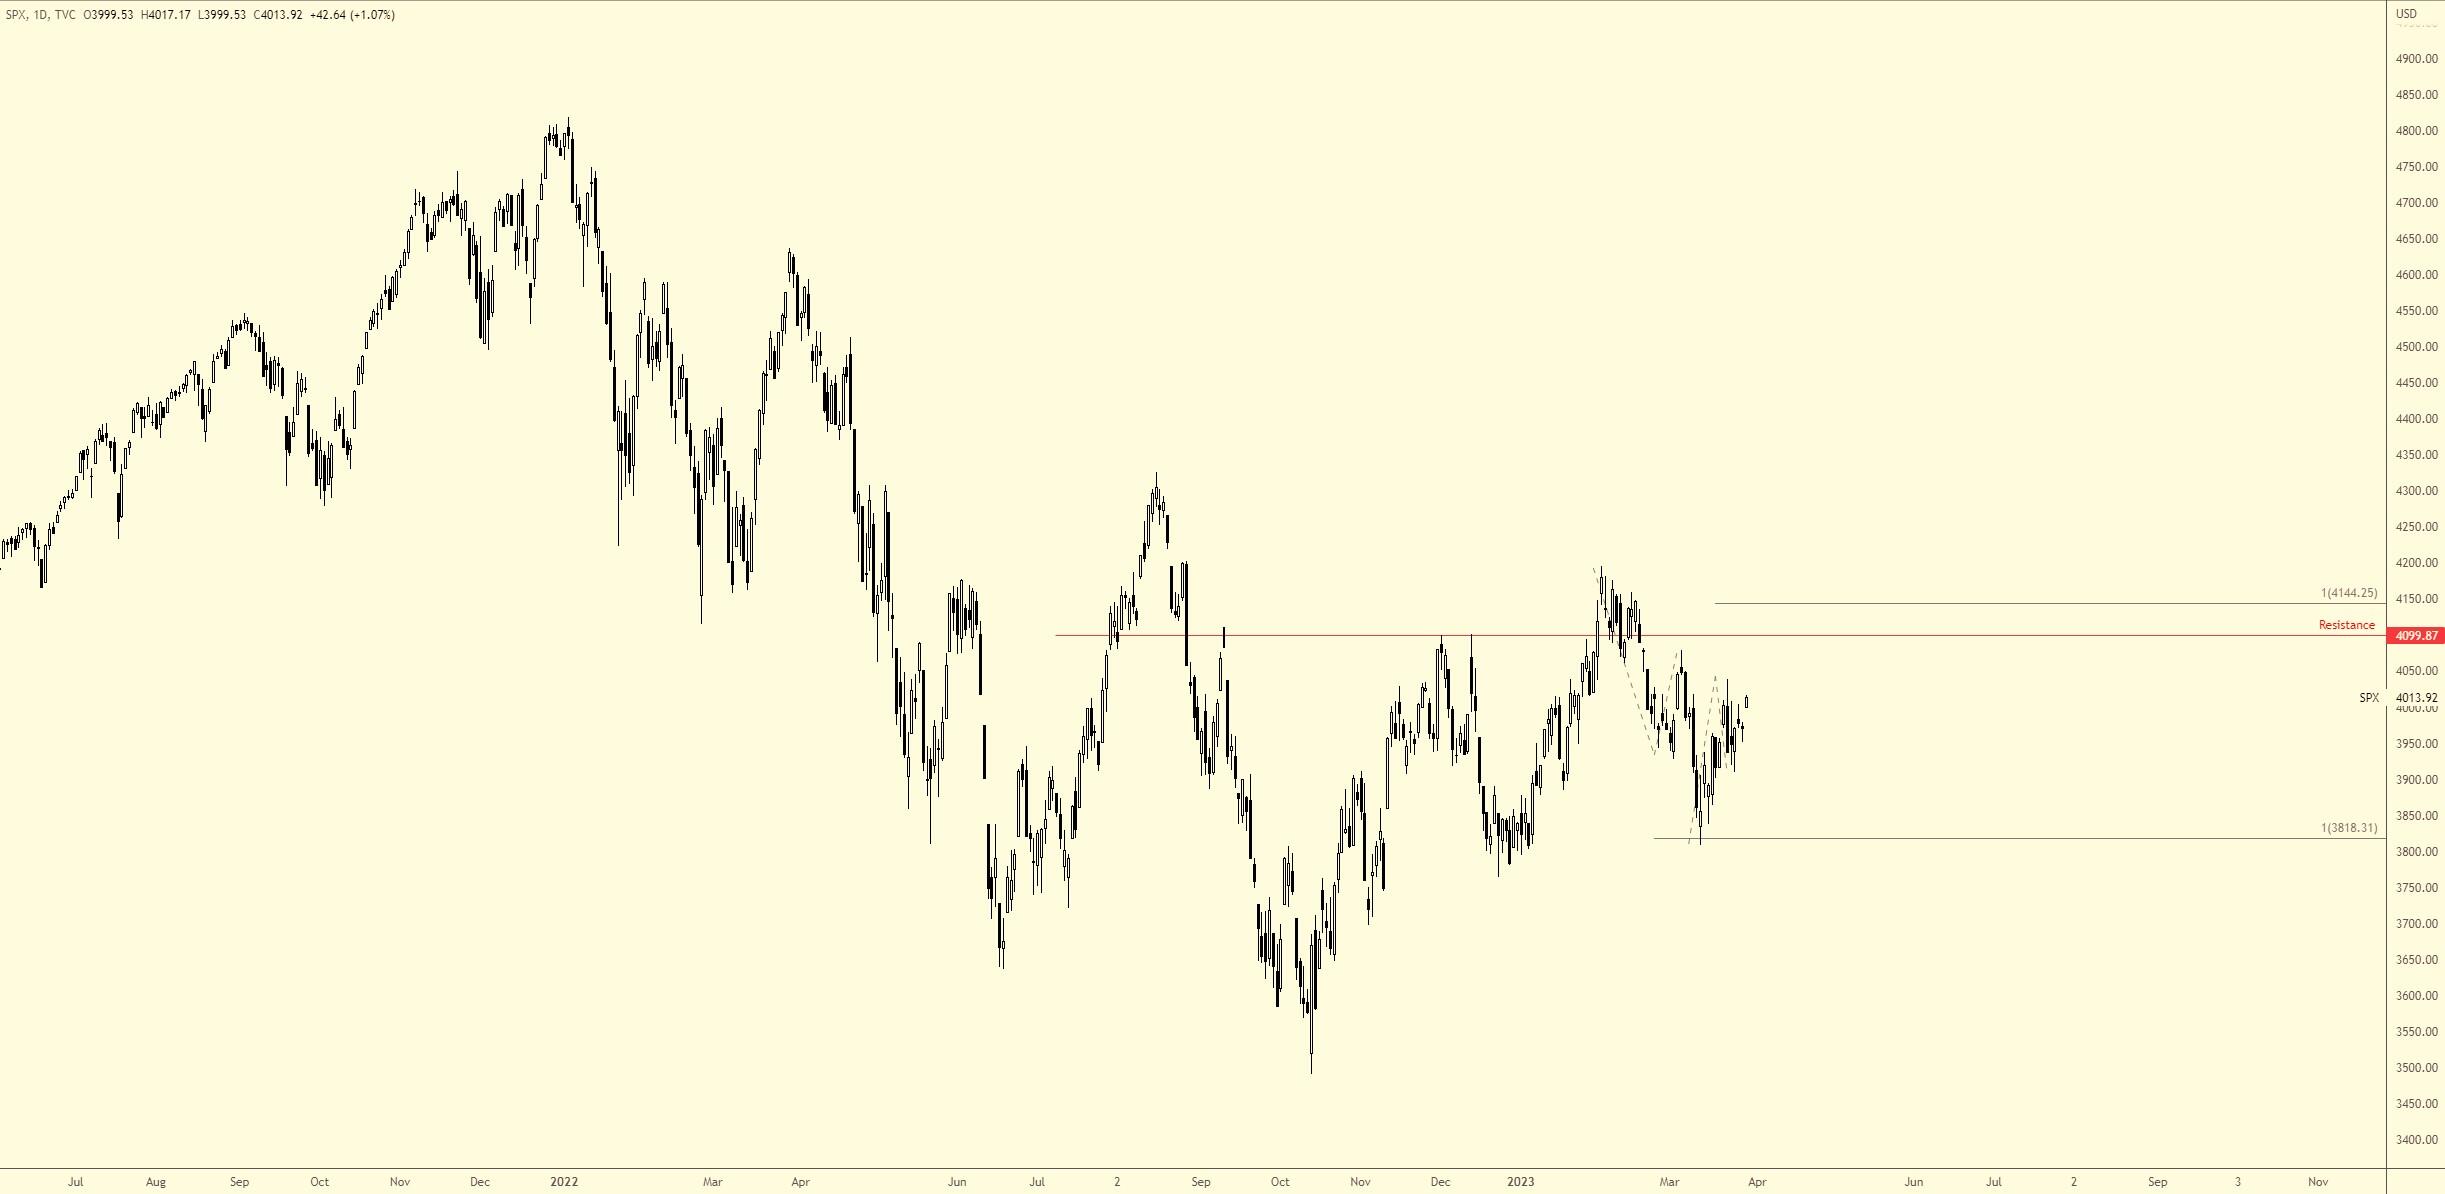
The S&P 500, on the other hand, leans more in favour of the bulls in terms of trend direction, despite recently forming a lower high/low that touched a 100% projection at 3,818 on 13 March. Following the rebound from the noted 100% projection, which is also an AB=CD bullish formation, Harmonic traders will acknowledge a potential AB=CD bearish pattern unfolding, denoted through a 100% projection at 4,144. Additionally, I see resistance present at 4,099.
Author

Aaron Hill
FP Markets
After completing his Bachelor’s degree in English and Creative Writing in the UK, and subsequently spending a handful of years teaching English as a foreign language teacher around Asia, Aaron was introduced to financial trading,


