| Rationale | Bullish/Bearish | Levels anticipated |
| Likely Scenario – BOE liftoff delayed to Q3/Q4 2016 – Slowing economy BOP concerns Brexit fears & Fed to continue policy tightening, but at a slower-than-expected rate | Bearish | 1.45-1.4280 in H1, followed by a recovery in H2 as BOE liftoff nears |
| Bullish Surprise – BOE lifts rates in Q1/Q2 (low probability)/ and, or Fed refrains from raising rates in 2016 | Bullish | 1.5930 in H1, followed by profit taking in H2 |
| Bearish Surprise – UK BOP concerns take Centerstage (high probability) | Bearish | 1.3954 followed by further sell-off if trade deficit does not drop in H2 |
The year that went by...
The cable weakened in the first four months of 2015 on the threat of a hung parliament. But a decisive victory for the Tories led to a spike to 1.5929, which was followed by a drop to 1.5026 in November on falling BOE rate hike bets and increased odds of the Fed tightening.Throughout 2015, Sterling remained relatively resilient to increased odds of the Fed tightening as the markets believed the BOE would follow the Fed with its own liftoff. Consequently, the EUR/GBP was one the major losers, while GBP/comm$ pairs were one of the major beneficiaries.
BOE liftoff could be delayed
The UK manufacturing has been hit by the strong pound and weakness in its main export markets, while one may say the service sector, which accounts for more than 75% of the economy has held up well.UK service sector PMI – On a declining trend
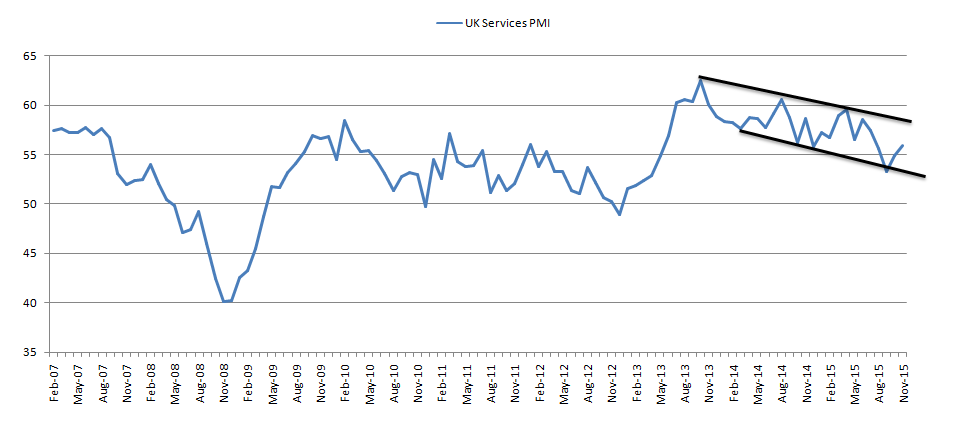
However, the services PMI figure dropped to its lowest figure in more than two years in September this year. A minor recovery was seen in October and November, but again the details showed consumers are becoming more cautious and reducing spending, while business confidence is being “knocked by global economic worries (primarily China)â€.
The consumer spending may remain weak in the early part of 2016 as Brexit fears and financial market volatility (due to Fed tightening) may hurt consumer confidence and business confidence.
UK worsening deficit could take a Centerstage
The UK balance of payment situation is serious and could take centre stage, although markets have been surprisingly ignorant about the same throughout 2015. The UK ran a current account deficit of 3.5% of GDP in 2012. The next year it rose to 4.7% of gross domestic product. Last year, it hit 5.9% of GDP.UK’s goods trade deficit
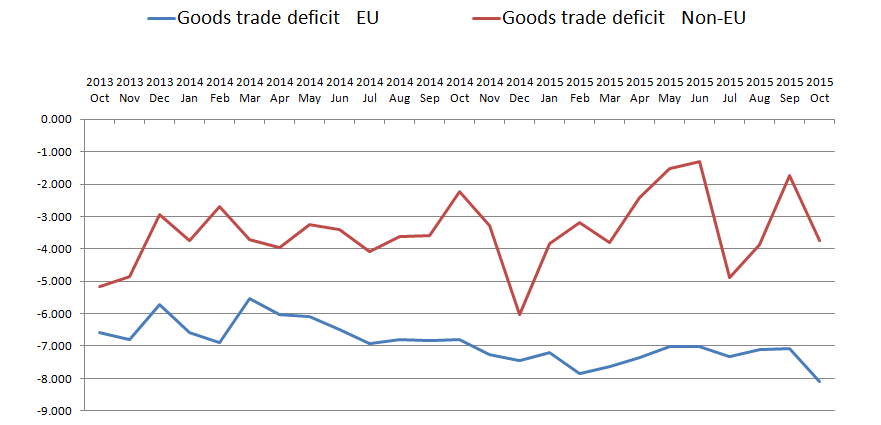
- The UK’s deficit with the non-EU countries held up well till June 2015, but fell sharply since then.
- Meanwhile, the UK’s deficit with the EU nations has topped out in April 2014 and fell to the lowest in the last two years in October.
- The UK’s days as a net oil exporter are far behind, there is a sizeable deficit on visible trade – manufactured goods, raw materials, oil and food. The deficit on investment is also bigger than the one on goods and services.
Weak EUR is hurting UK’s exports – The EUR has been offered heavily since Apr-May 2014, which explains the UK’s rising trade deficit with the EU nations. Given the ECB is on a easing mode, there is a low possibility of a sharp rise in the EUR/USD alone without serious risk aversion. This also means the EUR/GBP is likely to remain weak under normal circumstance. Amid risk aversion, even if the GBP drops against the EUR, it would not helpe UK exports since turmoil ould also hit economic activity. Thus, it appears the BOE may want to hold rates low and avoid further deterioration of the deficit with the EU nations.
Low inflation, BOE could afford to wait
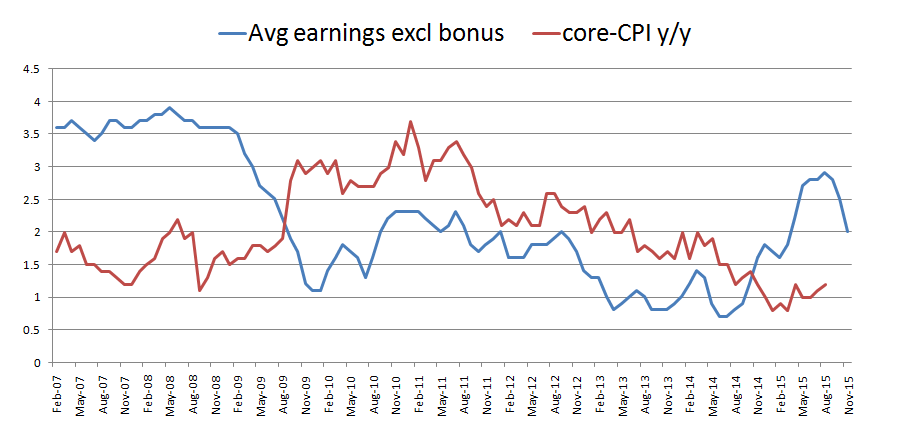
The UK economy is flirting with deflation since the last couple of months. However, the headline CPI figure has lost its relevance simply because lower energy prices is a well known fact and the central banks across the developed world are no more interested in fighting oil-driven low inflation with interest rate cuts or QE.
Hence, the focus is on the core inflation, which too is not impressive. The jump in the average earnings pay since July 2014 has not had much of an impact on the core figure as well.
The BOE policy makers doubt the sustainability of the earnings growth and need more evidence regarding the same before deciding on the liftoff.
UK Unemployment rate completed a lap
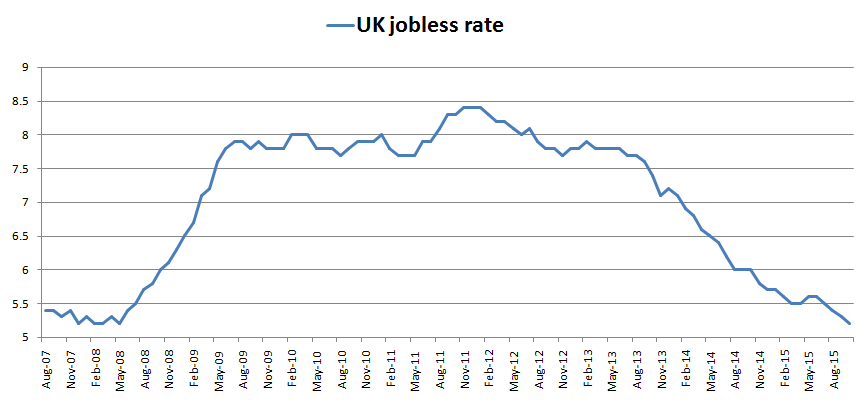
- The UK jobless rate fell from 5.3 to 5.2% in the three months to October as the number of people in work rose 207,000 to a record 31.3m. Unemployment was last this low in 2008 and has not been lower since January 2006.
- The Labor Force Participation Rate in the United Kingdom increased to 78.10% in September, which is higher than the long-term average of 76.49%. The uptick in the labor force participation from the 2008 low contradicts the drop seen in the US.
Brexit fears could weigh over Sterling
Prime Minister David Cameron has hinted a referendum on the future of Britain’s membership of the EU could be held as early as June 2016. A new poll carried out by ICM for the Vote Leave campaign found that when the undecided are discounted, those who with to remain in the EU accounts for 50 per cent of those asked.The exact risk to the UK economy due to Brexit is still being discussed by the experts. However, the general consensus is that BRexit would be bad for the UK; in economic as well as political terms. Consequently, the consumer confidence and the business confidence are likely to remain under pressure as we move closer to the Brexit vote. This is another factor that could force the BOE to hold rates unchanged at least in the first half of 2016.
Moreover, Sterling could be offered heavily (the way it fell ahead of Scottish referendum in 2014), if the markets begin to suspect that the UK may vote to leave the EU.
Miners and Energy firms could add to unemployment
Gone are the days when the UK was a net oil exporter. Now there is a sizeable deficit on visible trade – manufactured goods, raw materials, oil and food. So a lower oil price is a boon as it could reduce the deficit. But, we have already seen the deficit has been growing each passing month.Meanwhile, Oil and other industrial metals’ prices could continue to drop further on oil oversupply and China slowdown. This can create a serious problem of joblessness. Approx. 5,500 jobs have already disappeared in the North Sea oil sector. The Mining heavyweight Anglo American also cut 85,000 jobs. With a little/no scope for recovery in commodity prices, the situation could easily worsen.
This sectoral unemployment would not be an issue if the domestic consumption would have spiked in response to lower inflation. However, that too does not seem to be happening, which means the displaced workers are unlikely to be absorbed in other sectors. This is yet another reason why the BOE could afford to keep rates at record lows.
SONIA predicting liftoff in Feb 2017
The Sterling Overnight Index Average or SONIA forwards show the traders are fully pricing in a 25 basis points in February 2017. The past history shows the Bank of England has followed the Federal Reserve’s lift off within three months. However, the Sonia forwards indicates a lag of 14 months this time.GBP/USD – Odds of a bearish move are high in 2016
- Overall, the cable appears weak as the Fed has indicated four rate hikes next year and we shall have to wait at least till March 2016 Fed statement to see if the Fed backtracks from its hawkish hint in December.
- The Brexit fears in H1, along with the delay in the BOE liftoff is likely to keep Sterling under pressure.
- We may be in for a serious fall if the markets focus on the worsening UK current account to GDP ratio. Sterling could target 1.3954 in this case.
- On the other hand, a hint of an early BOE liftoff would be a major surprise that shall send the Sterling towards 1.5930 levels. The cable could also rally if the Fed comes out dovish at its March 2016 meeting.
GBP/USD Technicals – Increased odds of a drop to 1.45-1.42
Bearish move in 2014 – Sterling failed to break above the inverted head and shoulder neckline resistance at 1.4930 on the daily chart in June and since then has been moving in a falling channel.Monthly chart – eyes 1.4480
_20151223095009.png)
- The chart shows two symmetrical triangles marked by black lines and black-blue line.
- Sterling’s failure to see a bullish break from the symmetrical triangle in June, followed by a bearish break in August and failure to re-enter the same in September and October led to a further bearish break below the blue line.
- An attempt to take out the blue trend line resistance was thwarted earlier this month, following which the candle has turned lower.
- Consequently, the odds of a drop to 1.4480-1.4460 (red trend line support) in the next couple of months is high.
- A break below the same would expose 1.4372 (76.4% of 2009 low-2014 high) and 1.4281 (23.6% of life time high-low)
Daily Chart – short-term correction possible
_20151223095041.png)
- Sterling could find support at 1.48 (violet trend line). A rebound form the trend line cannot be ruled out since the intraday indicators are oversold.
- Consequently, the pair may re-test 1.50 levels (violet and blue falling trend line resistance). A break higher would expose another falling trend line (red) resistance currently seen at 1.5170-1.5180.
- The outlook on the daily charts would turn bullish only if the pair sees a daily close above the falling channel (represented by the black lines) - currently at 1.52. In this case the key upside levels mentioned below would come into play.
| Key levels on the upside | Key levels on the downside |
| 1.5309 (23.6% of Nov 2007 high-Jan 2009 low) | 1.4564 (2015 low) |
| 1.58 (monthly chart symmetrical triangle resistance) & 1.5814 (50-month MA) | 1.4281 (23.6% of life time high-low) |
| 1.5930 (2015 high) | 1.3948 (Sep 2000 low) |
GBPUSD Point & Figure Charts Forecast by Gonçalo Moreira, CMT
In point and figure charts, the price is always subject to an uptrend or to a downtrend line. In a GBP/USD 3-box reversal chart, where each box is worth 150 pip, the trend comes dictated by a bearish 45º line. This ceiling, which was threatened by a double-top signal in July this year, was reversed with a bearish reversal pattern erasing at the same time the bullish trend line drawn from the April low at 1.4565. This signal reinforces the bearish development for the next months and perhaps years in this pairing.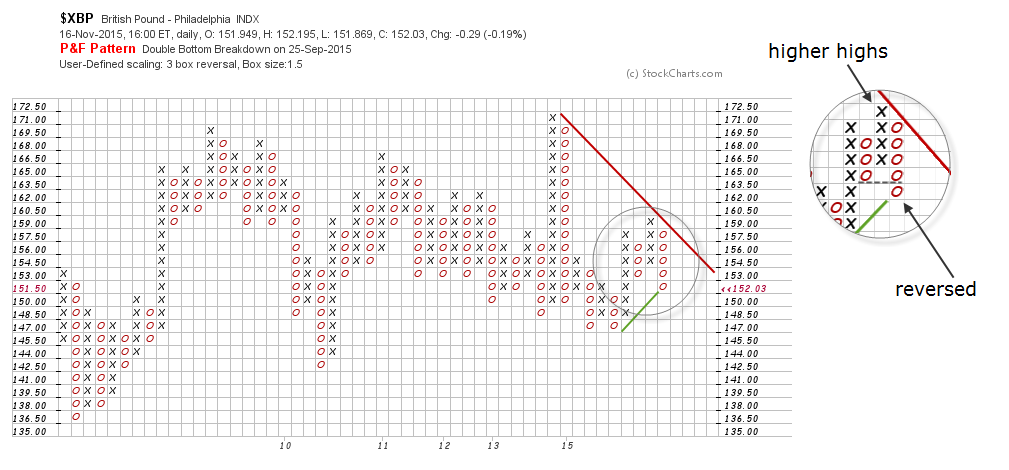
The same negative bias is seen in a 1-box reversal for the sterling market. The downside risk implied by two horizontal counts resulting from the consolidation formed since Spring 2015 is 1.3400 and well below the early 2009 low, 1.3000. No upside target is valid in this resolution, the reason being the bearish semi-catapult already breaking down on two occasions (see chart below).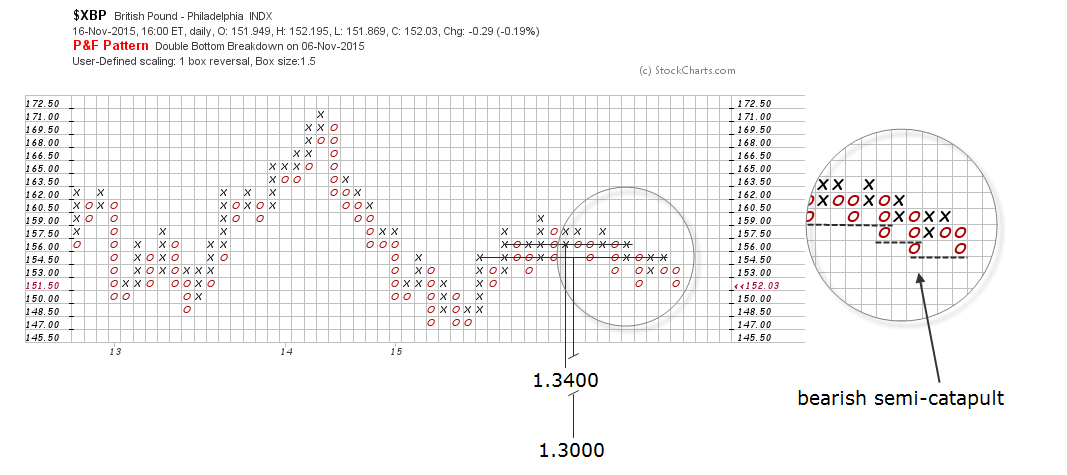
Read also other related articles about what 2016 could bring for the markets:
Currencies
EUR USD Forecast 2016
USD JPY Forecast 2016
Central Banks
ECB Forecast 2016
RBA Forecast 2016
PBoC Forecast 2016
FED Forecast 2016
BoE Forecast 2016
BoJ Forecast 2016
SNB Forecast 2016
Commodities
Gold Forecast 2016
Information on these pages contains forward-looking statements that involve risks and uncertainties. Markets and instruments profiled on this page are for informational purposes only and should not in any way come across as a recommendation to buy or sell in these assets. You should do your own thorough research before making any investment decisions. FXStreet does not in any way guarantee that this information is free from mistakes, errors, or material misstatements. It also does not guarantee that this information is of a timely nature. Investing in Open Markets involves a great deal of risk, including the loss of all or a portion of your investment, as well as emotional distress. All risks, losses and costs associated with investing, including total loss of principal, are your responsibility. The views and opinions expressed in this article are those of the authors and do not necessarily reflect the official policy or position of FXStreet nor its advertisers. The author will not be held responsible for information that is found at the end of links posted on this page.
If not otherwise explicitly mentioned in the body of the article, at the time of writing, the author has no position in any stock mentioned in this article and no business relationship with any company mentioned. The author has not received compensation for writing this article, other than from FXStreet.
FXStreet and the author do not provide personalized recommendations. The author makes no representations as to the accuracy, completeness, or suitability of this information. FXStreet and the author will not be liable for any errors, omissions or any losses, injuries or damages arising from this information and its display or use. Errors and omissions excepted.
The author and FXStreet are not registered investment advisors and nothing in this article is intended to be investment advice.
Recommended Content
Editors’ Picks

EUR/USD trims losses and approaches 1.0800 after US data
The US Dollar renewed its bullish momentum on Tuesday, pressuring EUR/USD and keeping the pair under the critical 1.0800 threshold following the release of US ISM Manufacturing PMI and JOLTS readings.

GBP/USD meets support around 1.2880, USD remains strong
After bottoming out around the 1.2880 region, GBP/USD now manages to attempt a bounce and flirt with the 1.2900 zone in the wake of weaker-than-expected US data releases.

Gold looks range bound above $3,100
Gold is easing from its fresh record high near $3,150 but remains well supported above the $3,100 mark. A generalised pullback in US yields is underpinning the yellow metal, as traders stay on the sidelines awaiting clarity on upcoming US tariff announcements.

Dogecoin bulls defend lifeline support as risk-off sentiment continues
Dogecoin trades at $0.1731 during early American hours on Tuesday after recovering from Monday’s support at $0.16. The leading meme coin faced negative headwinds early in the week as investors reacted to comments by Tesla CEO Elon Musk, who heads the special Department of Government Efficiency (D.O.G.E.) in the US.

Is the US economy headed for a recession?
Leading economists say a recession is more likely than originally expected. With new tariffs set to be launched on April 2, investors and economists are growing more concerned about an economic slowdown or recession.

The Best brokers to trade EUR/USD
SPONSORED Discover the top brokers for trading EUR/USD in 2025. Our list features brokers with competitive spreads, fast execution, and powerful platforms. Whether you're a beginner or an expert, find the right partner to navigate the dynamic Forex market.