We got 48 answers and here we present the results of the first part of this survey, which was about predicting the best and worst performing major FX pairs and the first semester prices of the most traded assets in the markets.
Which of these currencies do you expect to perform the best against the USD in 2016? And the worst?

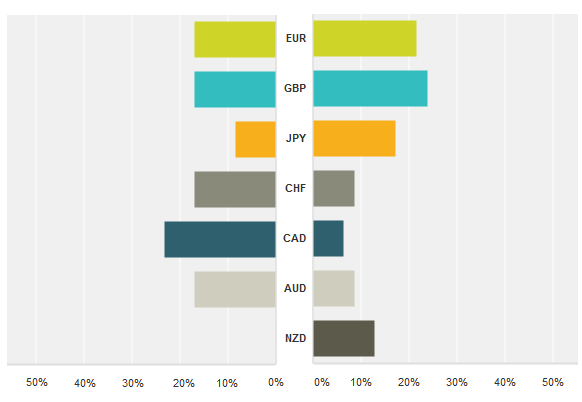
This two-way chart allows us to show the bull/bear side of how the main currencies may perform against the US Dollar during 2016. At the right side you can view the amount of contributors predicting each currency to be the best performing of the list against the USD, while at the left side the worst-performers votes are represented.
The chart shows some interesting trends, as the slightly more bullish than bearish result in the EUR (10 bulls, 8 bears) and the GBP (11 bulls, 8 bears), which is kind of odd if we consider the price predictions we will read later, specially in the British Pound. The JPY (8 bulls, 4 bears) and the NZD (6 bulls, 0 bears) are the currencies more clearly bullish (yes, no one thinks the kiwi will be the worst performer in 2016), while the CHF (4 bulls, 8 bears), the AUD (also 4 and 8) and specially the CAD (3 bulls, 11 bears) are notably bearish.
Which price do you foresee for the EURUSD at the end of the first semester of 2016?
_20160107150048.png)
EURUSD closed the year around 1.08 and the average forecast from our contributors is placed just a pip short of that level, at 1.0799, meaning that the bulls/bears are split 50-50. It's interesting to notice, looking at the histogram, that the mode of predictions is located around parity, with most of the bears constrained in a quite tight range (1.00-1.05). On the opposite side, the bulls are quite spread going from 1.10 to 1.31.
Which price do you foresee for the GBPUSD at the end of the first semester of 2016?
_20160107150131.png)
Regarding the cable, the answers of our contributors show a slight bearish bias. The average forecast is placed in 1.4808, a few pips below the 2015 close. Again, it's interesting to notice that the mode (1.45) is located far from the average and the lowest forecast (1.3) is more far than the highest (1.64), which may reinforce the bearish bias observed.
Which price do you foresee for the USDJPY at the end of the first semester of 2016?
_20160107150209.png)
Our contributors are on average bullish on the USDJPY. The average forecast is at 122.00, clearly over the 120.40 where the pair closed last year. It is noticeable the symmetric distribution of the histogram here, with 122-123 acting as the mode and similar spreads on both sides. Both the lowest (100) and the highest (150) are quite extreme but similarly spread from the average. Therefore, with the latter being clearly over the close, we can settle for a bullish bias on this one.
Which price do you foresee for Gold at the end of the first semester of 2016?
_20160107150245.png)
This is an interesting histogram, as there are significant levels all over the chart. At first glance, we observe the average (1047) really close to the last price of 2015 (1050), but there are only three contributors predicting the gold price to be between 1030 and 1070 at the end of the first semester. The mode is located quite below, at the round price of 1000, but there are also significant accumulations of forecasts around 950, 1100 and 1150. Therefore, we can infer that gold price will be an asset tough to predict going forward, with bulls and bears quite convinced they can take the price to their side but eventually could cancel each other.
Which price do you foresee for the WTI Oil barrel at the end of the first semester of 2016?

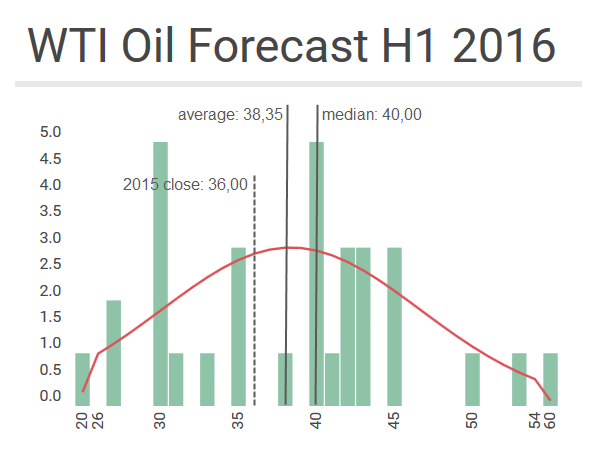
It's kind of surprising to look at this histogram just when oil is occupying headlines with its recent 12-year lows, but our contributors are actually bullish on average. The WTI barrel closed the year at 36$ and the average forecast for the first half of 2016 is at 38.35$. There are two modes, one at 30$ and another at 40$, but the second one has a significant amount of observations around, with 15 of the 33 predictions (a considerable 45%) stuck in the 40$-45$ range.
Which price do you foresee for the DJIA at the end of the first semester of 2016?

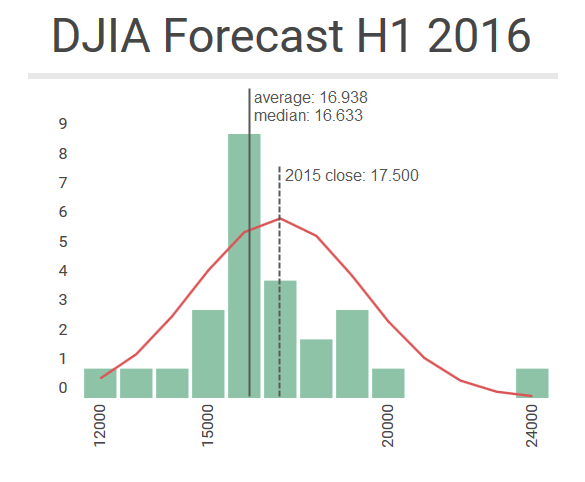
We also got a bonus question on a stocks index. Here we have a more predictable outcome. The DJIA forecasts are bearish on average but most of the observations are located around the 16000-18000 range, where the index closed 2015.
Click here to read the second part of the survey, about macroeconomic topics and trends.
Information on these pages contains forward-looking statements that involve risks and uncertainties. Markets and instruments profiled on this page are for informational purposes only and should not in any way come across as a recommendation to buy or sell in these assets. You should do your own thorough research before making any investment decisions. FXStreet does not in any way guarantee that this information is free from mistakes, errors, or material misstatements. It also does not guarantee that this information is of a timely nature. Investing in Open Markets involves a great deal of risk, including the loss of all or a portion of your investment, as well as emotional distress. All risks, losses and costs associated with investing, including total loss of principal, are your responsibility. The views and opinions expressed in this article are those of the authors and do not necessarily reflect the official policy or position of FXStreet nor its advertisers. The author will not be held responsible for information that is found at the end of links posted on this page.
If not otherwise explicitly mentioned in the body of the article, at the time of writing, the author has no position in any stock mentioned in this article and no business relationship with any company mentioned. The author has not received compensation for writing this article, other than from FXStreet.
FXStreet and the author do not provide personalized recommendations. The author makes no representations as to the accuracy, completeness, or suitability of this information. FXStreet and the author will not be liable for any errors, omissions or any losses, injuries or damages arising from this information and its display or use. Errors and omissions excepted.
The author and FXStreet are not registered investment advisors and nothing in this article is intended to be investment advice.
Recommended Content
Editors’ Picks

AUD/USD weighed down by China, tariffs
AUD/USD remained on the back foot, slipping back to the area of multi-year lows around 0.5950 on the back of mounting fears surrounding tariffs and their impact on the Chinese economy.

EUR/USD refocuses on 1.1000 amid tariffs jitters
EUR/USD reversed two daily pullbacks in a row an d managed to advance to the boundaries of the 1.1000 barrier on the back of fresh weakness hurting the US Dollar and persistent tariff fears.

Gold erases gains, back to the $2,980 zone
Gold prices now lose extra ground and slip back to the area of daily troughs near $2,980 mark per troy ounce following an unsuccesful attempt to maintain the trade above the critical $3,000 level earlier in the day.

RBNZ set for another interest rate cut amid trade tariff uncertainty
The Reserve Bank of New Zealand is on track to deliver a 25 basis point cut to the Official Cash Rate, bringing down the key policy rate from 3.75% to 3.50% following its April monetary policy meeting on Wednesday.

The Fed is looking at a hefty price level
We are still in thrall to tariffs, the faux-macro “data” driving markets. The WSJ editorial board advised other countries to take their tariffs to zero so that Trump’s “reciprocal” tariffs will have to be zero, too. Cute, but no cigar.

The Best brokers to trade EUR/USD
SPONSORED Discover the top brokers for trading EUR/USD in 2025. Our list features brokers with competitive spreads, fast execution, and powerful platforms. Whether you're a beginner or an expert, find the right partner to navigate the dynamic Forex market.