Dark Window Update: Nasdaq 11,000 by Late May or 13,500 by Late September

I almost always have two shorter-term scenarios, as there are more cycles and politics matters much, much more in the short-term. My megaphone vs. continued blow-off scenarios kept staying in play, back-and-forth, until the Fed repo crisis injections forced the blow-off scenario to win. The final confirmation came last Friday with the end-of-day rally to break out of a channel pattern to the upside.
My original dark window scenario from the January Boom & Bust issue played out, just having taken a little longer than my first expectation for a late 2019 peak.
I thought the final blow-off, orgasmic phase of this unprecedented bubble bull market started when Trump won by surprise in November 2016… nope! It started after that 25% sharp correction into late December 2018 – just as the last tech bubble final blow-off started after a similar sharp correction into late 1998.
That final and steepest fling occurred from October 1999 into March 2000, with the $120 billion Fed injection for the Y2K scare. That would have been more like $300 billion in today’s economy. But unlike the late stage crypto bubble today, the internet stocks were a part of the Nasdaq index, and hyped it much more back then.
As I covered last Wednesday, the repo crisis forced the Fed to reverse its tapering, and it has injected $425b (billion) just between mid-September and mid-January with plans from February forward to inject $60b in T-bill purchases, $20b in bonds and $30b+ in repos. That’s $110b+ a month compared to $106b average since mid-September and $60 billion at peak QE in 2014. And it’s likely to be more on the repos.
Look at the correlation between the final rally in the 2000 tech bubble vs. the one today on a logarithmic chart as these are in two different realms of numbers and percentage gains.
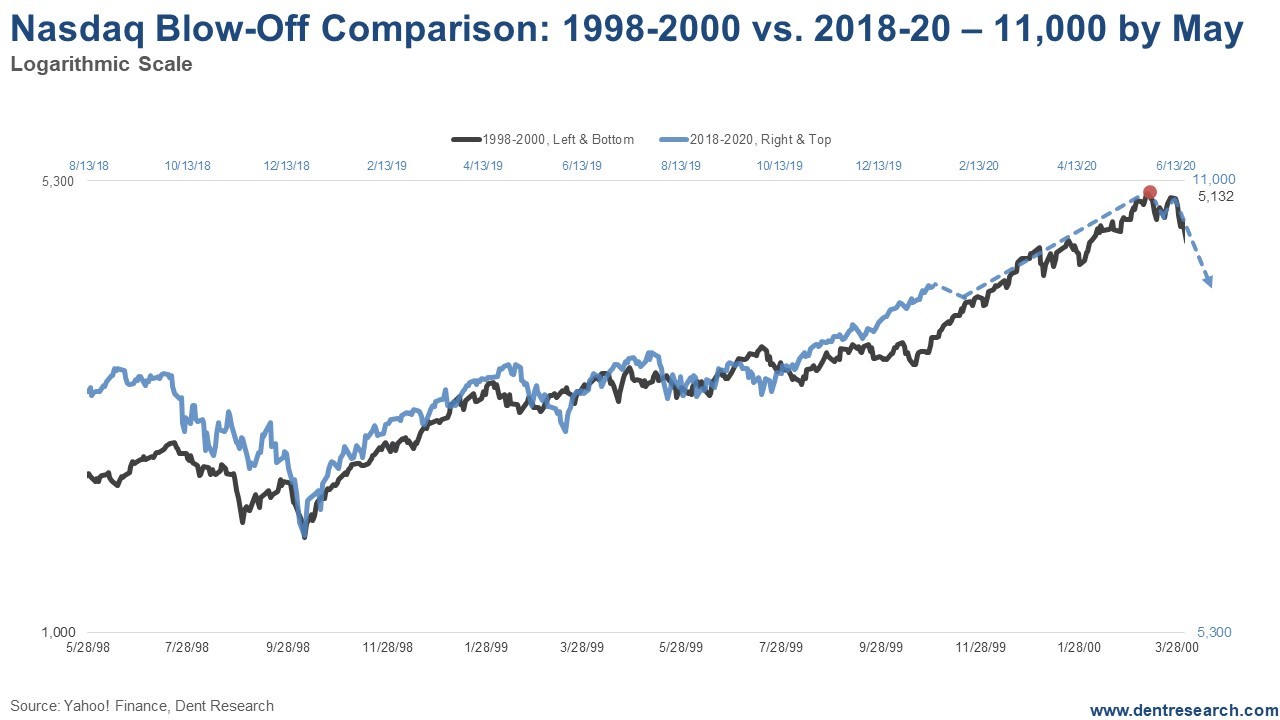
The current pattern would project a peak around late May near 11,000 Nasdaq. That’s just above my top trend-line projection for the Nasdaq, around 10,400 with a classic overthrow finale.
As long as the Fed continues this new twice as aggressive QE out of the repo crisis excuse, this should be the minimum this finale should last. If the market peaked in late May, the distance between the 2020 and 2000 bubble top vs. the 2000 and 1987 one would be a perfect Fibonacci ratio of 1.618.
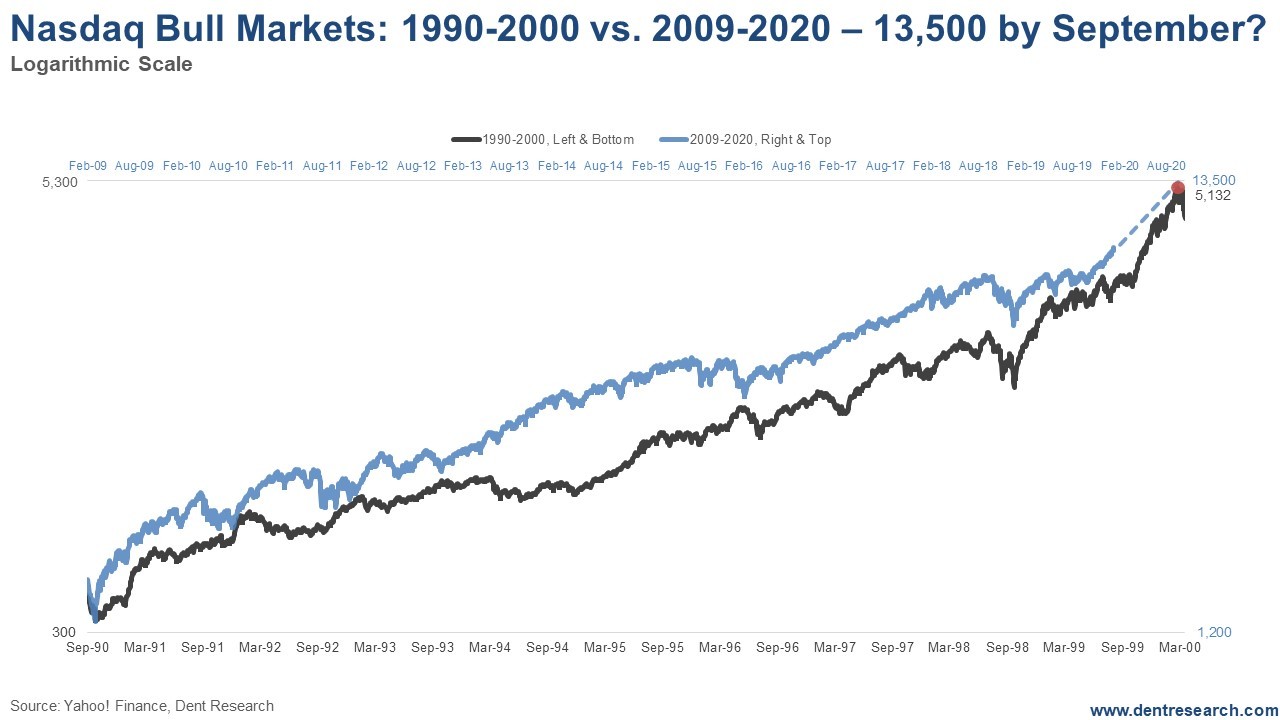
The next chart looks at the entire two longest bull markets in history: Oct 1990 to March 2000 vs. March 2009 to now.
This rally up through the final sharp bottoms in late 1998 and late 2018 is tracking to be about 22% longer – 11.5 years vs. 9.4 previous. If the peak follows that track, the projection would be near 13,500 Nasdaq by late September…. holy crap! That would not be hard if the Fed keeps up the repo madness gravy train.
So, strong sailing ahead, and definitely not time to be selling stocks yet, or even putting on hedges. Some may want to add a bit on a likely near-term 3% or so correction.
We’ll look for bigger shifts more likely into May. It will depend on how long the Fed can keep up this super-charged new QE and what Donald gets passed for direct to consumer stimulus if need be.
I’ll have a full report in the March Boom & Bust issue.
P.S. If you missed the live broadcast the Delta Profit Summit, where my colleague here at Charles Street Research Michael Coolbaugh, pulled back the curtain to reveal one of Wall Street’s very own algorithms and how you can use it yourself to generate impressive returns and give your portfolio one more big boost in this bull market. Click here to catch a recording of Michael’s presentation for free.
Author

Harry S. Dent, MBA
Dent Research
Harry S. Dent Jr. studied economics in college in the ’70s, but found it vague and inconclusive. He became so disillusioned by the state of his chosen profession that he turned his back on it.


