EUR/USD Current Price: 1.1387
View Live Chart for the EUR/USD
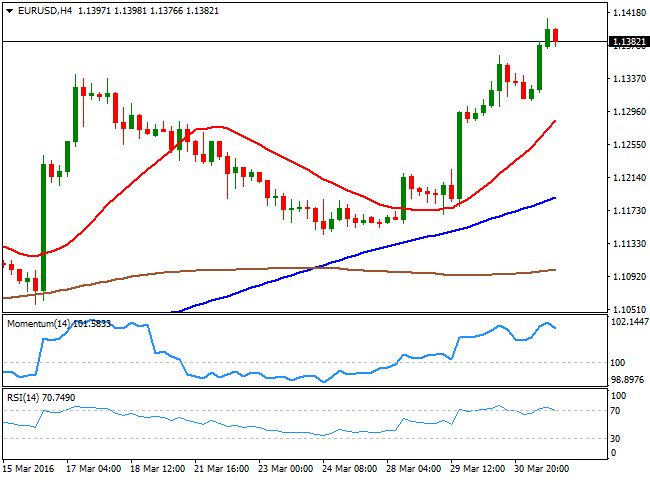
The American dollar remained vulnerable this Thursday, with the EUR/USD pair reaching its highest for the year at 1.1411, even despite poor data out of the Euro Zone. According to official releases, German unemployment was unchanged in March, snapping a run of five consecutive declines, although the unemployment rate held at its record low of 6.2%. Retail Sales in the country, fell by 0.4% during February, whilst it rose 5.4% in real terms compared to a year before.
In the US, weekly unemployment claims in the week ending March 26 reached 276K, above expected, while the 4-week moving average was 263,250, an increase of 3,500 from the previous week's unrevised average of 259,750. The Chicago PM increased to 53.6 in March, led by a recovery in production and employment. Markets, however, turned thin mid American afternoon, ahead of the release of the US Nonfarm Payroll report early Friday. The employment data may put a halt to current dollar's decline, but it will take much more than one strong job's number to turn the current bearish trend of the greenback.
In the meantime, the 4 hours chart for the EUR/USD pair shows that the technical indicators have turned lower within overbought territory, as the pair has rallied with little corrections in the middle ever since the week started. Nevertheless, the RSI indicator remains above 70, and the price far above a bullish 20 SMA, as the price holds above its previous yearly high of 1.1375, all of which maintains the risk towards the upside. The pair may suffer a downward knee-jerk on a very strong US report, particularly if wages surge beyond expected, but after the dust settles, speculative interest will be likely looking to buy the dips.
Support levels: 1.1365 1.1330 1.1290
Resistance levels: 1.1410 1.1460 1.1500
EUR/JPY Current price: 128.07
View Live Chart for the EUR/JPY
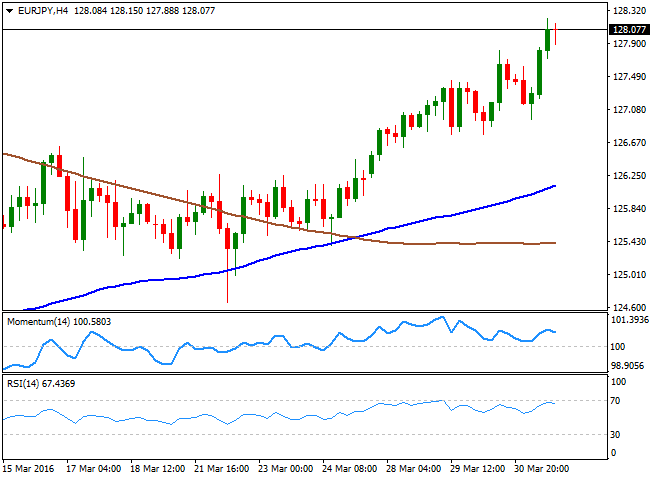
The EUR/JPY pair extended its rally beyond the 128.00 level and holds above the critical level ahead of Friday's Asian opening, with increasing EUR demand taking the pair to its highest in 7 weeks. The pair has now risen for sixth day in-a-row, which means there's the risk of downward corrective movement this Friday', regardless the currencies' self strength/weakness. Now standing a few pips below its 100 DMA currently at 128.40, the short term technical picture keeps favoring the upside, as in the 1 hour chart, the price is well above its moving average, with the 100 SMA having widened the distance with the 200 SMA, far below, indicating bulls remain in the driver's seat, whilst the Momentum indicator keeps heading north, despite being in overbought territory. In the 4 hours chart, however, the technical indicators continue to present bearish divergences, as the Momentum indicator posts lower highs whilst the price posts higher ones. Should the price break above the mentioned 128.40, the upward momentum will likely prevail, and the pair will be on its route to 130.00 early next week.
Support levels: 127.70 127.25 126.80
Resistance levels: 128.40 128.90 129.35
GBP/USD Current price: 1.4374
View Live Chart for the GBP/USD
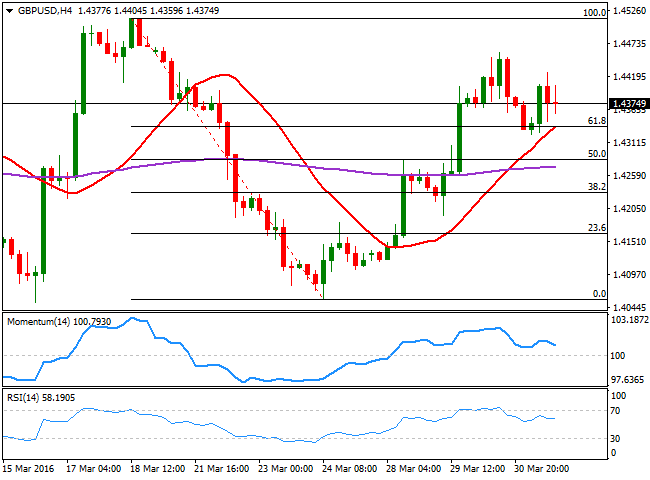
The GBP/USD pair closed the day flat, in spite of an upward revision of the local GDP and broad dollar´s weakness. Early during the London session, the UK released the final revision of its Q4 2015 GDP, up to 0.6% from a previous estimate of 0.5%, while the annual figure resulted at 2.1% from a previous 1.9%. The faster-than-expected growth was led by the services sector, but overall, this is old news, and had little effect over the price. At the same time, the UK released its Q4 current account, which posted a record high deficit of £32.7B. Technically, the pair has managed to hold above the 61.8% retracement of its latest decline around 1.4330, as a deep towards 1.4325 was quickly reverted. Having traded in quite a limited range for the past two sessions, the 1 hour chart presents a neutral-to-bullish stance, as the price holds above a horizontal 20 SMA, whilst the technical indicators hold flat within positive territory. In the 4 hours chart, the technical indicators head south within positive territory, having posted lower highs from yesterday, increasing the risk of a downward move. The immediate support comes at 1.4330, the mentioned 61.8% Fibonacci retracement and also the 20 SMA in the 4 hours chart, which reinforces the strength of the level, and therefore has more bearish implications on a break below it.
Support levels: 1.4330 1.4290 1.4250
Resistance levels: 1.4420 1.4460 1.4515
USD/JPY Current price: 112.49
View Live Chart for the USD/JPY
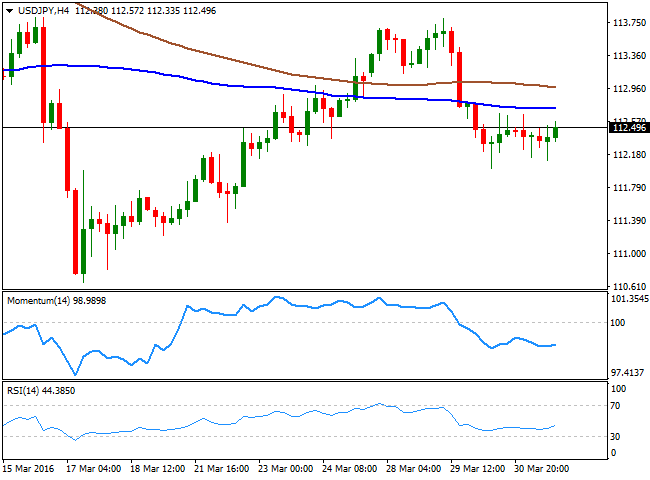
The USD/JPY pair was unmotivated this Thursday, trading in a tight 50 pips range ever since the day started. Japan will release its Tankan manufacturing data during the upcoming Asian session, expected to show a dismal decrease during the first quarter of the year. A negative reading may fuel speculation of further easing coming from the BOJ and send the pair higher, although the reaction could be limited ahead of the US monthly employment report to be released on Friday. In the meantime, the bearish trend has paused, but not reverted, and investors are still willing to push the pair towards the 110.00 region, to test BOJ's determination to keep the JPY lower. Short term, the 1 hour chart shows that the price has been unable to advance beyond its 200 SMA, the immediate resistance around 112.60. The Momentum indicator heads higher within positive territory, but the RSI indicator has turned flat around its mid-line, leaving little room for additional gains. In the 4 hours chart, the technical indicators have lost their bearish strength within bearish territory, but remain well below their mid-lines, with no certain directional strength, as the price remains below its moving averages.
Support levels: 111.90 111.50 111.00
Resistance levels: 112.60 113.10 113.35
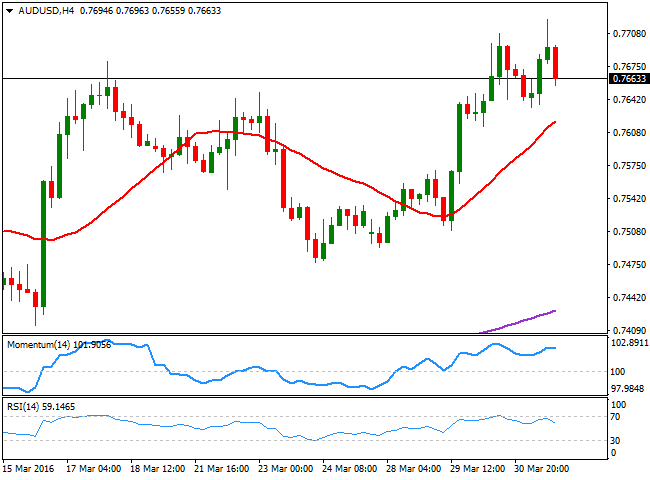
AUD/USD Current price: 0.7663
View Live Chart for the AUD/USD
The AUD/USD pair rallied up to 0.7722, a fresh 8-month high, but retreated below the 0.7700 level, weighed by a decline in commodities' prices and by month-end profit taking. The Aussie however, is still among the strongest currencies of the FX board, underpinned by strong local data. During the past Asian session, Australia released another private sector credit print up by 0.6% monthly basis and 6.6% compared to a year before. Both, China and Australia will release manufacturing data, and if these beats expectations, the AUD/USD pair may finally settle above the 0.7700 figure and attempt to extend its rally. Short term, the 1 hour chart shows that the price is hovering around a horizontal 20 SMA, whilst the technical indicators have retreated within positive territory, and are currently turning flat around their mid-lines, giving no directional clues. In the 4 hours chart, however, and despite the technical indicators are retreating from overbought territory, the upward trend prevails, given the strength of the 20 SMA, heading north below the current level, and the fact that the pair remains above past week´s highs.
Support levels: 0.7620 0.7570 0.7525
Resistance levels: 0.7710 0.7765 0.7800
Information on these pages contains forward-looking statements that involve risks and uncertainties. Markets and instruments profiled on this page are for informational purposes only and should not in any way come across as a recommendation to buy or sell in these assets. You should do your own thorough research before making any investment decisions. FXStreet does not in any way guarantee that this information is free from mistakes, errors, or material misstatements. It also does not guarantee that this information is of a timely nature. Investing in Open Markets involves a great deal of risk, including the loss of all or a portion of your investment, as well as emotional distress. All risks, losses and costs associated with investing, including total loss of principal, are your responsibility. The views and opinions expressed in this article are those of the authors and do not necessarily reflect the official policy or position of FXStreet nor its advertisers. The author will not be held responsible for information that is found at the end of links posted on this page.
If not otherwise explicitly mentioned in the body of the article, at the time of writing, the author has no position in any stock mentioned in this article and no business relationship with any company mentioned. The author has not received compensation for writing this article, other than from FXStreet.
FXStreet and the author do not provide personalized recommendations. The author makes no representations as to the accuracy, completeness, or suitability of this information. FXStreet and the author will not be liable for any errors, omissions or any losses, injuries or damages arising from this information and its display or use. Errors and omissions excepted.
The author and FXStreet are not registered investment advisors and nothing in this article is intended to be investment advice.
Recommended Content
Editors’ Picks

AUD/USD: Extra gains need to clear 0.6400
AUD/USD rose for the third day in a row, approaching the key 0.6400 resistance on the back of the acute pullback in the US Dollar amid mounting recession concerns and global trade war fear.

EUR/USD: Powell and the NFP will put the rally to the test
EUR/USD gathered extra steam and advanced to multi-month peaks near 1.1150, although the move fizzled out somewhat as the NA session drew to a close on Thursday.

Gold looks offered near $3,100
Prices of Gold remain on the defensive on Thursday, hovering around the $3,100 region per troy ounce and retreating from earlier all-time peaks near the $3,170 level, all against the backdrop of investors' assessment of "Liberation Day".

Interoperability protocol hyperlane reveals airdrop details
The team behind interoperability protocol Hyperlane shared their upcoming token airdrop plans happening at the end of the month. The airdrop will occur on April 22, and users can check their eligibility to receive $HYPER tokens via a portal provided by the Hyperlane Foundation by April 13, the team shared in a press release with CoinDesk.

Trump’s “Liberation Day” tariffs on the way
United States (US) President Donald Trump’s self-styled “Liberation Day” has finally arrived. After four straight failures to kick off Donald Trump’s “day one” tariffs that were supposed to be implemented when President Trump assumed office 72 days ago, Trump’s team is slated to finally unveil a sweeping, lopsided package of “reciprocal” tariffs.

The Best brokers to trade EUR/USD
SPONSORED Discover the top brokers for trading EUR/USD in 2025. Our list features brokers with competitive spreads, fast execution, and powerful platforms. Whether you're a beginner or an expert, find the right partner to navigate the dynamic Forex market.
