EUR/USD Current Price: 1.1161
View Live Chart for the EUR/USD
Extreme thin conditions due to most markets being closed on holiday, saw majors confined to tight ranges on Friday. Asian markets were opened, but activity was limited. The American dollar edged higher across the board last week, and is poised to extend its advance this one, as on Friday, the US released its latest version of the Q4 2015 GDP, which surprised to the upside being revised higher, to 1.4% from the previous estimate of 1.0%.
Also, news over the weekend showed that China's industrial profits rose at the fastest pace since mid 2014, during the first two months of 2016, up by 4.8% from a year earlier. The positive data should spoke risk aversion and therefore keep the greenback marching at the new weekly opening. Nevertheless, the dollar is far from recovering the long term bullish potential seen by the ends of 2015, and will take more than just FED's officers jawboning, to trigger a more sustainable long term bullish trend.
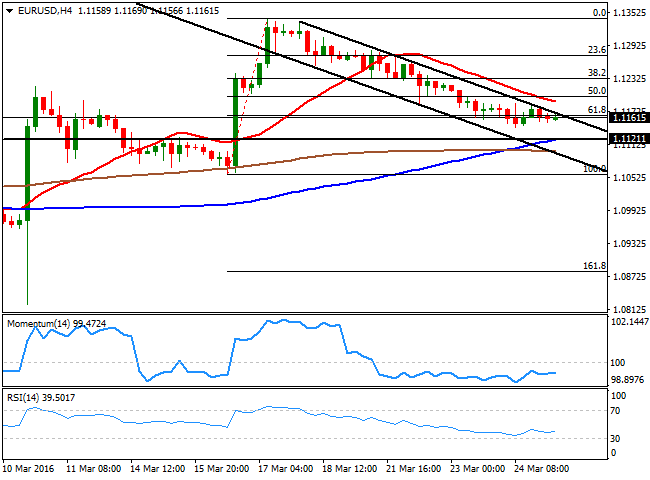
As for the technical picture of the EUR/USD pair, the price is stuck around the 61.8% retracement of the rally achieved post-FED, at 1.1165, presenting a neutral stance in the short term, given the lack of liquidity of these last days. The pair fell for the last five consecutive days, but the daily chart shows that the price remains above its moving averages, with the 20 SMA now heading north around 1.1130, and the technical indicators holding flat well into positive territory. Should the decline accelerate below 1.1120, the risk will turn lower, with chances then of a test of the 1.1000 level during the upcoming days.
Support levels: 1.1120 1.1085 1.1040
Resistance levels: 1.1200 1.1245 1.1290
EUR/JPY Current price: 126.19
View Live Chart for the EUR/JPY
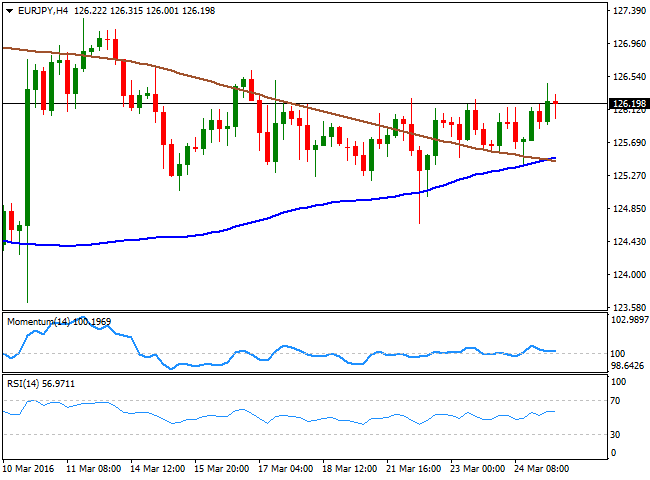
The EUR/JPY pair has been consolidating around the 126.00 level for most of the past week, rallying up to 126.45 on Friday, to close the week barely positive. Despite the latest news coming from Japan, showing inflation is still too low, and the subsequent speculation of further BOJ's easing, the Japanese Yen refuses to fall. The dollar has been the king this past week, getting a boost from US policy makers, who suggested the Central Bank will remain in the tightening path and is ready to raise rates as required, even next April, helping in keep the EUR/JPY range bound. Technically, the daily chart shows that the pair remains well below its moving average, with the 100 DMA currently around 128.63, which means that a break above it required to consider a more constructive long term tone. In the same chart, the technical indicators hold within positive territory, but lack directional strength. In the 4 hours chart, the pair is currently above its 100 and 200 SMAs, both around 125.60, although the technical indicators present a neutral stance, which means further technical confirmations are required before the pair can rally up to 127.30, this March high.
Support levels: 125.70 125.40 125.00
Resistance levels: 126.45 126.90 127.30
GBP/USD Current price: 1.4120
View Live Chart for the GBP/USD
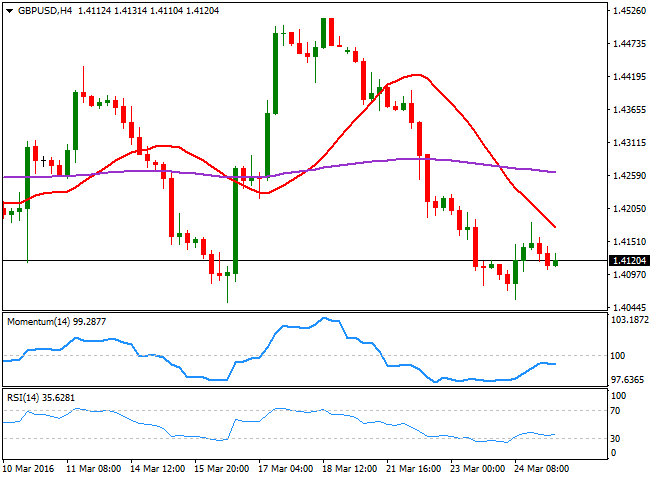
The Sterling underperformed its counterparts, weighed by concerns over a possible Brexit, and the GBP/USD pair is at risk of further declines, as the data-triggered rally seen on Thursday was rejected near 1.4200. Having held a few pips above the 1.4100 level on Friday, the downward risk prevails, most likely until the ends of June when the Referendum will take place. Technically, the pair has met strong buying interest on declines towards 1.4050 during the last two weeks, making of the level the one to beat to trigger stops and additional slides. The daily chart presents a limited bearish tone, as the price stands below its 20 SMA, whilst the technical indicators present tepid bearish slopes below their mid-lines. Short term, the 4 hours chart shows that the price has broken below its 200 EMA, now around 1.4260, while the 20 SMA heads sharply lower above the current price, offering an immediate resistance in the 1.4180 region. In the same chart, the technical indicators have corrected oversold readings, but lost steam within bearish territory. The immediate support comes at 1.4100, followed by the mentioned 1.4050 level, which if it's broken can lead to an extension below the 1.4000 figure at the beginning of the upcoming week.
Support levels: 1.4100 1.4050 1.4010
Resistance levels: 1.4200 1.4235 1.4260
USD/JPY Current price: 113.06
View Live Chart for the USD/JPY
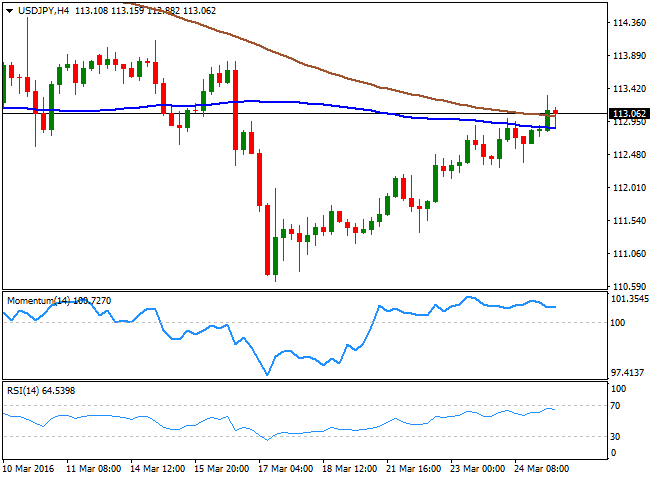
The USD/JPY pair rallied up to 113.32 last week, reaching the mentioned high early Friday, following the release of February Japanese inflation figures, which fueled speculation the BOJ will be forced to add more stimulus sooner or later. The headline National CPI up 0.3% compared to a year before, and in line with expectations. Excluding volatile food and energy prices, the CPI rose by 0.8% year-on-year. The pair later retraced partially ahead of the daily close, but held above the 113.00 figure, helped by the upward revision of the US GDP figures for the last quarter of 2015. Despite having advance all of the five days of the past week, the upward potential is still quite limited, given that in the daily chart, the pair is over 400 pips below a bearish 100 SMA, whilst the Momentum indicator retreats from its mid-line, and the RSI indicator consolidates below 50. In the 4 hours chart, the price is above its 100 and 200 SMAs, while the technical indicators hold within positive territory, lacking directional strength amid the latest absence of volatility. The pair however, can gap higher at the opening, fueled by positive Chinese data released over the weekend.
Support levels: 112.90 112.40 112.00
Resistance levels: 113.30 113.75 114.00
AUD/USD Current price: 0.7528
View Live Chart for the AUD/USD
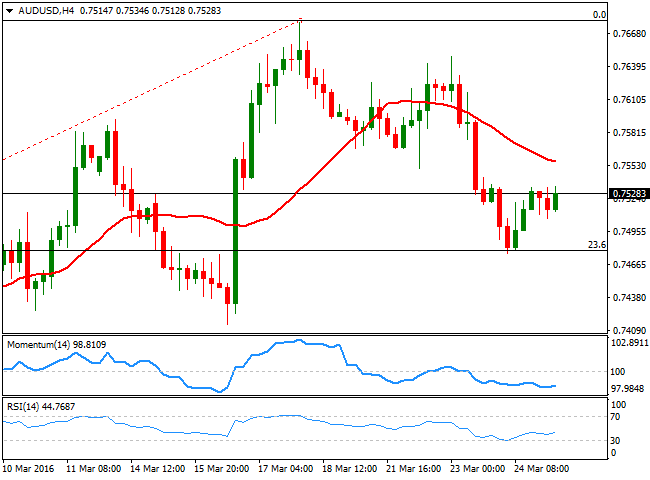
The Aussie retreated alongside with commodities last week, closing against the greenback at 0.7528. The AUD/USD pair briefly breached below the 0.7500 level past Thursday on broad dollar strength, but market is still interested on buying the dips in the pair. So far, the latest decline seems just corrective, as the pair retreated to the 23.6% retracement of the bullish run between 0.6827 and 0.7679, at 0.7476. The downward correction may extend on a break below this last, but given the positive data released by China over the weekend, chances are of a recovery for this Monday. Technically however, the bearish potential has increased, but it still needs confirmation, as in the daily chart, the technical indicators head lower around their mid-lines, whilst the price pressures a bullish 20 SMA. In the 4 hours chart, the price remains below a bearish 20 SMA, while the technical indicators have bounced partially from oversold readings, limiting chances of a stronger decline, but far from suggesting a steeper recovery. At this point, the pair needs to rally beyond the 0.7600 figure to regain its bullish strength, and be able to extend its gains to new monthly highs.
Support levels: 0.7510 0.7475 0.7440
Resistance levels: 0.7560 0.7605 0.7640
Information on these pages contains forward-looking statements that involve risks and uncertainties. Markets and instruments profiled on this page are for informational purposes only and should not in any way come across as a recommendation to buy or sell in these assets. You should do your own thorough research before making any investment decisions. FXStreet does not in any way guarantee that this information is free from mistakes, errors, or material misstatements. It also does not guarantee that this information is of a timely nature. Investing in Open Markets involves a great deal of risk, including the loss of all or a portion of your investment, as well as emotional distress. All risks, losses and costs associated with investing, including total loss of principal, are your responsibility. The views and opinions expressed in this article are those of the authors and do not necessarily reflect the official policy or position of FXStreet nor its advertisers. The author will not be held responsible for information that is found at the end of links posted on this page.
If not otherwise explicitly mentioned in the body of the article, at the time of writing, the author has no position in any stock mentioned in this article and no business relationship with any company mentioned. The author has not received compensation for writing this article, other than from FXStreet.
FXStreet and the author do not provide personalized recommendations. The author makes no representations as to the accuracy, completeness, or suitability of this information. FXStreet and the author will not be liable for any errors, omissions or any losses, injuries or damages arising from this information and its display or use. Errors and omissions excepted.
The author and FXStreet are not registered investment advisors and nothing in this article is intended to be investment advice.
Recommended Content
Editors’ Picks

EUR/USD tests fresh tops above 1.0870 on NFP
The selling bias in the US Dollar gathers extra pace on Friday after the US economy created fewer jobs than initially estimated in February, sending EUR/USD to the area of new highs around 1.0870.

GBP/USD hovers around recent highs above 1.2900
The continuation of the downward trend in the Greenback encourages GBP/USD to maintain the trade just above the 1.2900 mark following the release of US NFP in February.

Gold remains bid above $2,900 after US Payrolls
Gold prices manage to leave behind Thursday’s pullback and revisits the area of $2,920 per troy ounce in the wake of the publication of the US labour market report in February.

White House Crypto Summit could boost adoption across financial markets: Binance exec Rachel Conlan
US President Donald Trump signed an executive order for a Strategic Bitcoin Reserve on Friday, shifting industry leaders’ focus from regulation to adoption. Within just over six weeks of his term, the President is set to host the first Crypto Summit, hosting industry giants and executives from the ecosystem.

February CPI preview: The tariff winds start to blow
Consumer price inflation came out of the gate strong in 2025, but price growth looks to have cooled somewhat in February. We estimate headline CPI rose 0.25% and the core index advanced 0.27%. The moderation in the core index is likely to reflect some giveback in a handful of categories that soared in January.

The Best brokers to trade EUR/USD
SPONSORED Discover the top brokers for trading EUR/USD in 2025. Our list features brokers with competitive spreads, fast execution, and powerful platforms. Whether you're a beginner or an expert, find the right partner to navigate the dynamic Forex market.
