EUR/USD Current Price: 1.1182
View Live Chart for the EUR/USD
The dollar was broadly firmer against its major rivals this Thursday, but the rally faded in the American afternoon, on tepid US data and as investors secure gains ahead of the long weekend. This Friday, most major markets will remain closed amid the Easter Holiday, although the US will release its final revision of the Q4 2015 GDP. Given that is the last revision, the report tends to have a limited impact, which will be even lower it the reading match previous and expectations, which in this particular case converge at 1.0%.
As for US data released this Thursday, weekly unemployment claims fell to 265K, beating expectations, while the Markit Services PMI returned above the 50.0 threshold in March, up to 51.0, but below expectations of 51.3. Durable Goods Orders fell in February, reflecting a broad-based slowdown in US capital investment. Official data showed a 2.8% decline against a 4.2% gain in the previous month, whilst bookings for non-military capital goods excluding aircraft dropped 1.8%, well below market's expectations.
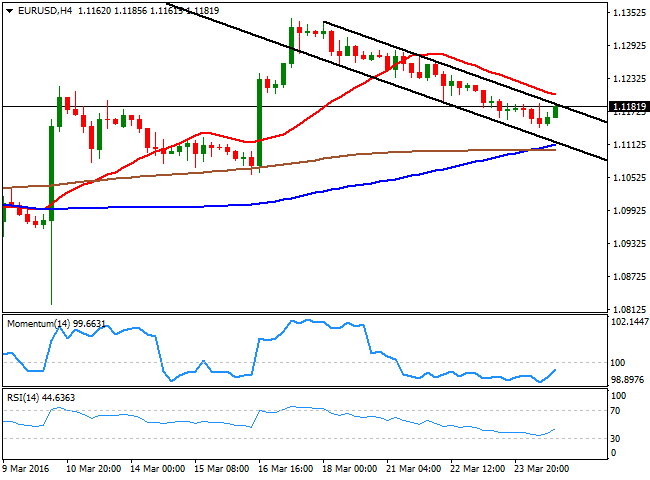
The EUR/USD pair trimmed its daily loses before the closing bell, but extended its weekly decline to 1.1143, and held below the 1.1200 level, overall retaining the bearish tone. With limited liquidity expected for this Friday, the pair can see some choppy action. Technically, the 4 hours chart shows that the roof of the daily descendant channel is currently being tested, and also that the technical indicators have bounced from oversold readings, but remain well into negative territory, far from suggesting a bullish run ahead. At this point, the price needs to regain the 1.1245 level to reverse its latest negative tone and be able to rally up to the 1.1290 region.
Support levels: 1.1120 1.1085 1.1040
Resistance levels: 1.1210 1.1245 1.1290
EUR/JPY Current price: 126.00
View Live Chart for the EUR/JPY
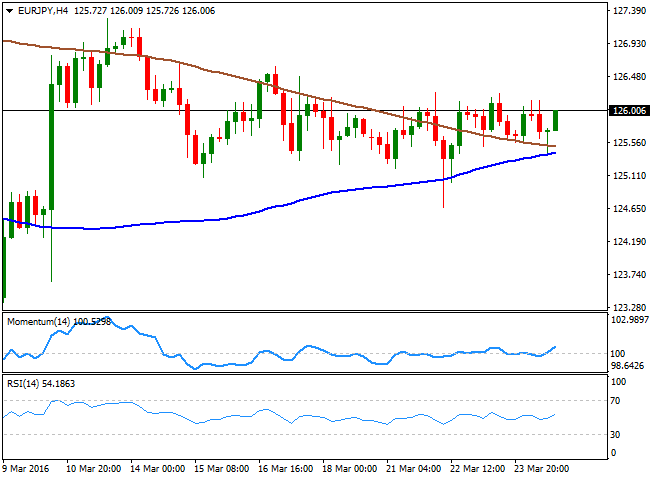
The EUR/JPY pair remained confined to a familiar range this Thursday, as investors were not sure on what to do with the Japanese Yen. The currency fell at the beginning of day as broad dollar's demand persisted during the Asian session, but failure of the USD/JPY to extend beyond 113.00 and falling equities sent it back higher. The common currency had little saying in the pair, trading in quite a limited range against most of its major rivals. Technically, the pair has recovered from a daily low at 125.38 and trades slightly above its daily opening, and the short term picture shows that the price is currently above its 100 and 200 SMAs, both lacking directional strength, while the technical indicators are crossing their mid-lines towards the upside, suggesting the pair may extend its advance towards the 126.15 region, the immediate resistance. In the 4 hours chart, the technical indicators have turned higher above their mid-lines, whilst the daily low converges with a bullish 100 SMA, indicating some increasing buying interest around the pair.
Support levels: 125.70 125.40 125.00
Resistance levels: 126.15 126.50 126.90
GBP/USD Current price: 1.4176
View Live Chart for the GBP/USD
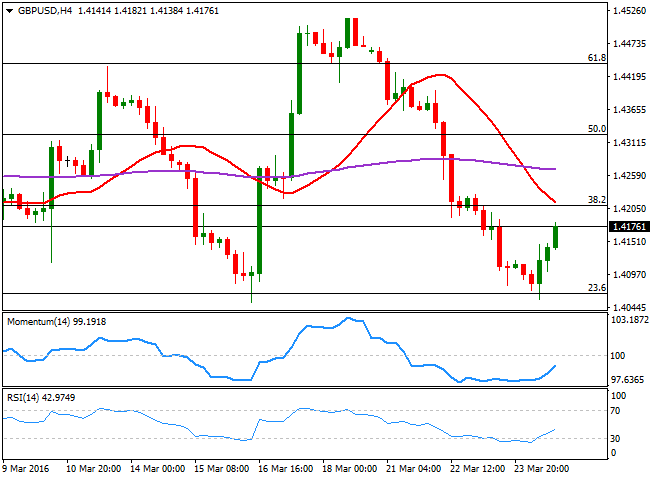
The British Pound rebounded after four straight days of declines, helped by the UK retail sales figures for February, slightly better-than-expected. Nevertheless sales fell 0.4% compared to the previous month, with the decline being blame to the slow start to sales of spring/summer clothing items. The year-on-year reading remained at 3.8%, generally strong according to historical standards. The GBP/USD pair recovered from a low set at 1.4054 ahead of the release, and rallied up to the 1.4180 region during the American afternoon standing nearby at the end of the day. The forthcoming EU referendum, however, remains in focus, and may see Sterling coming back under selling pressure. Technically, the pair has recovered from around the 23.6% retracement of this year's decline, and the 1 hour chart shows that the price has rallied above a horizontal 20 SMA during US trading hours, whilst the technical indicators are currently losing upward strength within bullish territory. In the 4 hours chart, the technical indicators continue heading north from oversold levels, but remain below their mid-lines, while the 20 SMA presents a strong bearish slope, converging with the 38.2% retracement of the mentioned rally around 1.4215, now the immediate resistance.
Support levels: 1.4160 1.4120 1.4070
Resistance levels: 1.4215 1.4250 1.4300
USD/JPY Current price: 112.73
View Live Chart for the USD/JPY
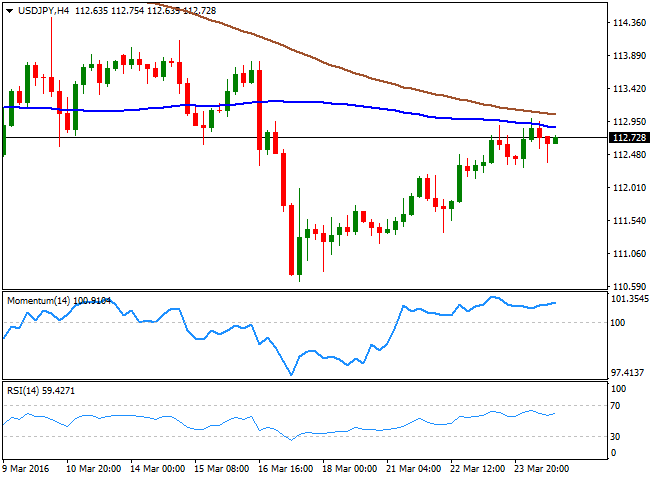
The USD/JPY pair kept advancing this Thursday, closing up by fifth consecutive day, although gains were modest, with intraday selling interest surging on approaches to the 113.00 level. Hawkish rhetoric from FED's officers this week has helped the pair in recovering from a multi-month low set at 110.66 by the end of last week, but buying interest seems to be decreasing at current levels. Anyway, the short term technical picture supports some additional advances, as in the 1 hour chart, the price is above its 100 and 200 SMAs, with the longest acting as an immediate support in the 112.40 region. In the same chart, the technical indicators have turned slightly lower, but remain so far in neutral territory. In the 4 hours chart, the 100 SMA has rejected advances already twice and is currently at 112.95 acting as an immediate resistance, while the technical indicators present tepid bullish slopes within bullish territory, indicating the pair may attempt once again to break above the critical psychological figure.
Support levels: 112.40 112.0 111.70
Resistance levels: 112.95 113.30 113.75
AUD/USD Current price: 0.7529
View Live Chart for the AUD/USD
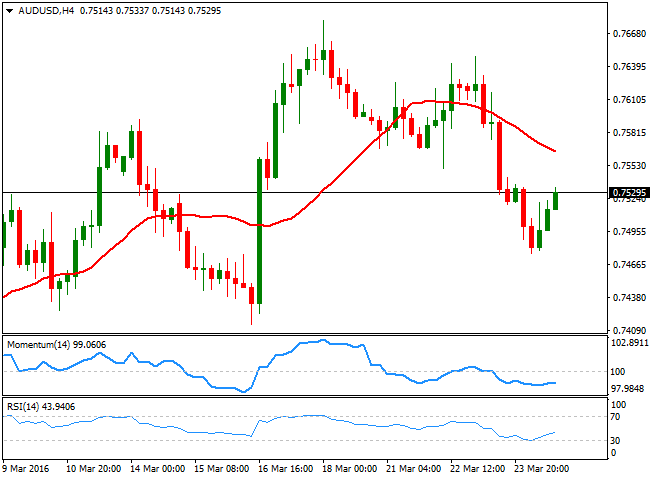
The Australian dollar traded heavily for most of this Thursday, weighed by the continued decline in base metals and oil, and the AUD/USD pair fell down to 0.4767, a 6-day low. The pair however, bounced in the American session and trimmed all of its daily losses as commodities bounced, and stocks pared their declines. The pair recovered above the 0.7500 figure and the long term bullish trend remains unharmed, as the price bounced strongly from a bullish 20 SMA in the daily chart, whilst the technical indicators have lost their bearish slopes and are currently recovering within positive territory. Shorter term, the 1 hour chart shows that the pair recovered above its 20 SMA, while the technical indicators stand in positive ground, but losing their previous bullish strength. In the 4 hours chart, the price remains below a bearish 20 SMA, now around 0.7560, while the technical indicators aim higher below their mid-lines, all of which limits chances of a steeper rally as long as the price remains below this last.
Support levels: 0.7470 0.7440 0.7400
Resistance levels: 0.7560 0.7605 0.7640
Information on these pages contains forward-looking statements that involve risks and uncertainties. Markets and instruments profiled on this page are for informational purposes only and should not in any way come across as a recommendation to buy or sell in these assets. You should do your own thorough research before making any investment decisions. FXStreet does not in any way guarantee that this information is free from mistakes, errors, or material misstatements. It also does not guarantee that this information is of a timely nature. Investing in Open Markets involves a great deal of risk, including the loss of all or a portion of your investment, as well as emotional distress. All risks, losses and costs associated with investing, including total loss of principal, are your responsibility. The views and opinions expressed in this article are those of the authors and do not necessarily reflect the official policy or position of FXStreet nor its advertisers. The author will not be held responsible for information that is found at the end of links posted on this page.
If not otherwise explicitly mentioned in the body of the article, at the time of writing, the author has no position in any stock mentioned in this article and no business relationship with any company mentioned. The author has not received compensation for writing this article, other than from FXStreet.
FXStreet and the author do not provide personalized recommendations. The author makes no representations as to the accuracy, completeness, or suitability of this information. FXStreet and the author will not be liable for any errors, omissions or any losses, injuries or damages arising from this information and its display or use. Errors and omissions excepted.
The author and FXStreet are not registered investment advisors and nothing in this article is intended to be investment advice.
Recommended Content
Editors’ Picks

EUR/USD advances to multi-day highs around 1.0860
EUR/USD is surging ahead, rapidly recovering and approaching multi-day highs around 1.0860. This boost comes on the heels of news that the EU might roll out countermeasures to soften the blow of Trump’s impending reciprocal tariffs.

GBP/USD flirts with tops near 1.2970 ahead of Trump's tariffs
GBP/USD is accelerating, challenging weekly highs near 1.2970 as a renewed, sharp drop in the Greenback sets the stage for the US 'reciprocal tariffs' announcement on "Liberation Day" at 20:00 GMT.

Gold looks consolidative near $3,120 ahead of Trump's “Liberation Day”
Gold is regaining momentum, climbing above $3,120 after a slight pullback from Tuesday’s near-record high of $3,150. Retreating US yields are bolstering XAU/USD, ahead of President Trump's official announcement of the reciprocal tariff measures later this Wednesday.

Trump Tariffs: Everything you need to know on “Liberation Day” Premium
The global trading system is about to be upended, but to what extent? Will markets have clarity or is it merely another phase in ongoing trade wars? Some answers are due on Wednesday at 20:00 GMT. Here is preview of the five critical things to watch.

Is the US economy headed for a recession?
Leading economists say a recession is more likely than originally expected. With new tariffs set to be launched on April 2, investors and economists are growing more concerned about an economic slowdown or recession.

The Best brokers to trade EUR/USD
SPONSORED Discover the top brokers for trading EUR/USD in 2025. Our list features brokers with competitive spreads, fast execution, and powerful platforms. Whether you're a beginner or an expert, find the right partner to navigate the dynamic Forex market.
