EUR/USD Current Price: 1.1222
View Live Chart for the EUR/USD
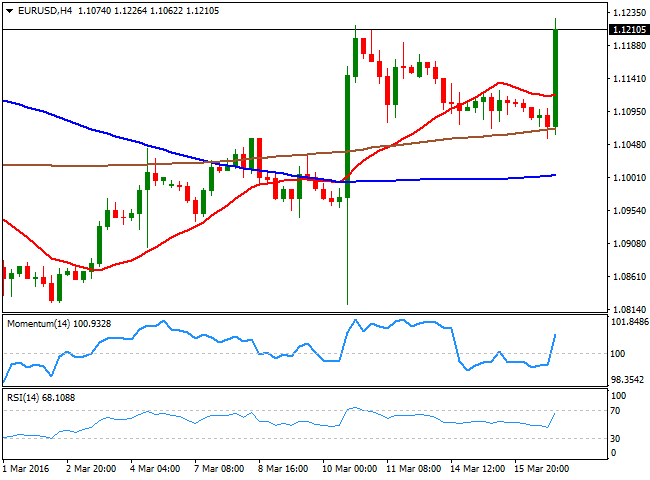
The American dollar maintained its bullish bias during the first half of the day, underpinned by a couple of economic reports early US session that pointed to some steady economic growth in the country. According to official data, Housing starts rose 5.2% in February, beating expectations, although Building Permits slipped 3.1%. Inflation in the same month, fell 0.2% as expected, but core readings surprised towards the upside posting solid gains up to 2.3% compared to a year before. Anyway, the market was all about the US Federal Reserve, and what they offered was not what the market was expecting. Policy makers see now just two rate hikes in 2015 from previous four, while they also cut the GDP forecast for 2016 down to 2.2% from 2.4%. The dollar was sold-off across the board, and the EUR/USD soared beyond 1.1217, the post-ECB high, with Janet Yellen´s press conference, indicating that major concerns are still abroad, but also that some participants don't longer saw the risk balanced, as some saw them tilted towards the downside.
The EUR/USD pair retreated from the 1.1226 posted with the news, but holds around the 1.1200 level, with strong bullish implications coming from technical readings, given that the pair has extended its monthly advance to a fresh high, while in the 4 hours chart, the strong advance has sent price well above its moving average, and left indicators heading sharply higher within bullish territory. Given the strong advance in Wall Street, Asian share markets will likely surge, maintaining the common currency supported. A major static resistance level stands around 1.1245, with a break beyond it exposing the pair to an advance towards 1.1300 this Thursday.
Support levels: 1.1160 1.1120 1.1065
Resistance levels: 1.1245 1.1290 1.1330
EUR/JPY Current price: 126.34
View Live Chart for the EUR/JPY
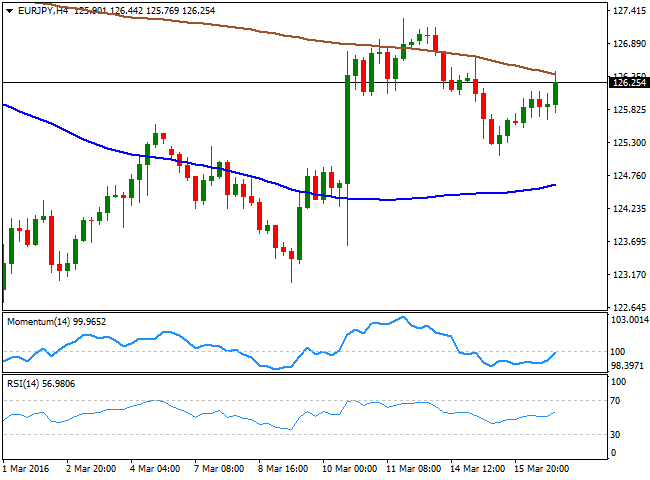
The EUR/JPY pair gained ground after a dovish FED, reaching 126.44, as JPY gains were limited on the back of soaring stocks. Despite trading in the green, the pair remains within Tuesday's range, having posted a lower high daily basis, which suggests the upside is still limited. In the shorter term, the 1 hour chart shows that the price is unable to advance above a bullish 100 SMA, while the technical indicators are losing upward strength within positive territory, far however, from suggesting a downward move ahead. In the 4 hours chart, the technical indicators head higher, with the RSI indicator already above its mid-line, but the price retreating form a bearish 200 SMA, in line with the shorter term outlook. Nevertheless, additional gains beyond 126.45 should see the pair extend its advance towards the weekly high, at 127.30.
Support levels: 125.80 125.40 125.00
Resistance levels: 126.45 126.90 127.30
GBP/USD Current price: 1.4244
View Live Chart for the GBP/USD
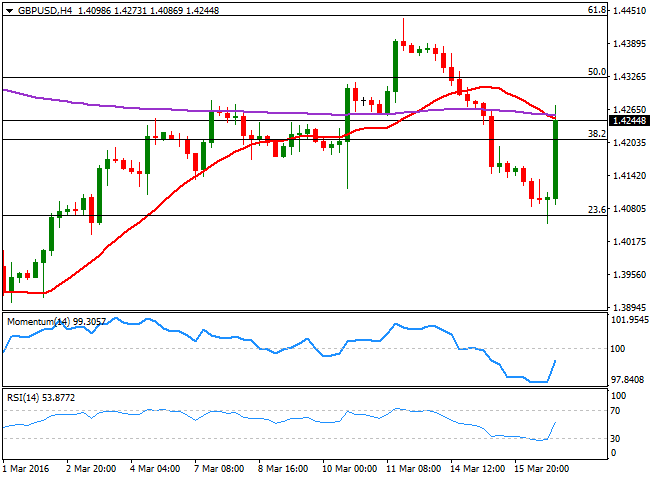
The British Pound weakened further against its major rivals, plummeting to 1.4052 against the greenback ahead of the FOMC meeting. The UK currency was sell-off mode last Tuesday as the latest ORB opinion poll showed that 47% wanted to remain within the EU compared to 49% who wanted to leave. The UK employment report resulted soft, with more jobs than-expected added in the three months to January, the unemployment rate steady at 5.1% and a tepid advance in wages. The data however, was not enough to save the Sterling. But the FED was, and the GBP/USD pair jumped to 1.4273, stalling its advance around the 200 EMA in the 4 hours chart, but holding above 1.4215, the 38.2% retracement of this year´s slide and the immediate support. In the mentioned time frame, the 20 SMA heads south a handful of pips below the mentioned high, while the technical indicators bounced sharply from oversold levels, and are currently crossing their mid-lines towards the upside, suggesting the recovery may extend, particularly on an upward acceleration beyond the mentioned daily high.
Support levels: 1.4215 1.4170 1.4125
Resistance levels: 1.4275 1.4310 1.4360
USD/JPY Current price: 112.39
View Live Chart for the USD/JPY
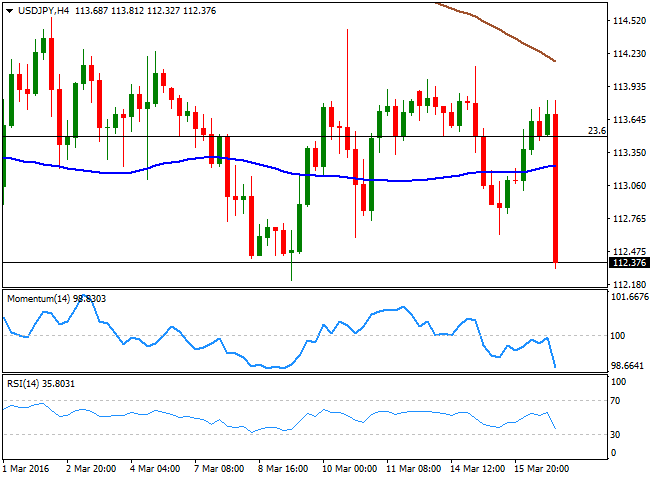
The Japanese yen slid during the Asian session, following dovish comments from BOJ's Governor Kuroda, who said that there are chances that the Central Bank will cut rates further into negative territory if needed, in a speech before the local parliament. The USD/JPY pair recovered up to 113.81, before plummeting to a fresh weekly low, with US treasury yields coming under pressure after the FOMC's announcement. The 2-year treasury yield fell to 0.912% from near 0.99%. The pair approaches the base of its latest range in the 112.10 region, and seems poised to extend its decline, given that in the 1 hour chart, the technical indicators head south almost vertically, despite being in extreme oversold territory. In the 4 hours chat, and after a period of consolidation around their mid-lines, the technical indicators resumed their declines, now heading sharply lower within bearish territory. Former lows around 112.60 are the immediate resistance, yet at this point, only a recovery above 113.00 will take out some of the bearish pressure from the pair.
Support levels: 112.10 111.70 111.30
Resistance levels: 112.60 113.00 113.50
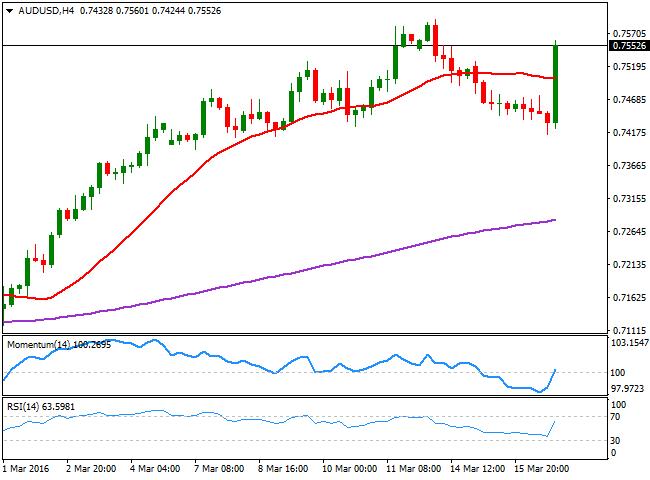
AUD/USD Current price: 0.7420
View Live Chart for the AUD/USD
It took the Aussie one hour to erase all of its last two-day decline against the greenback, with the pair soaring to 0.7560 after flirting with the 0.7400 level earlier today. The Australian dollar tracked stocks and commodities in its way higher, after the FED triggered a dollar's sell-off with quite a dovish stance. Ahead of the Asian opening, the pair has recovered its previous bullish tone, and seems poised to re-challenge the 0.7600 level. In the 1 hour chart, the technical indicators are losing partially their upward strength in overbought territory, but with the price far above its 20 SMA and pressuring the highs, the possibility of a bearish correction is practically null. In the 4 hours chart, the technical indicators have crossed their mid-lines towards the upside and maintain their strong upward slopes as the price crossed above a horizontal 20 SMA, now around 0.7500 with strong volume, supporting the shorter term view.
Support levels: 0.7500 0.7460 0.7420
Resistance levels: 0.7560 0.7600 0.7645
Information on these pages contains forward-looking statements that involve risks and uncertainties. Markets and instruments profiled on this page are for informational purposes only and should not in any way come across as a recommendation to buy or sell in these assets. You should do your own thorough research before making any investment decisions. FXStreet does not in any way guarantee that this information is free from mistakes, errors, or material misstatements. It also does not guarantee that this information is of a timely nature. Investing in Open Markets involves a great deal of risk, including the loss of all or a portion of your investment, as well as emotional distress. All risks, losses and costs associated with investing, including total loss of principal, are your responsibility. The views and opinions expressed in this article are those of the authors and do not necessarily reflect the official policy or position of FXStreet nor its advertisers. The author will not be held responsible for information that is found at the end of links posted on this page.
If not otherwise explicitly mentioned in the body of the article, at the time of writing, the author has no position in any stock mentioned in this article and no business relationship with any company mentioned. The author has not received compensation for writing this article, other than from FXStreet.
FXStreet and the author do not provide personalized recommendations. The author makes no representations as to the accuracy, completeness, or suitability of this information. FXStreet and the author will not be liable for any errors, omissions or any losses, injuries or damages arising from this information and its display or use. Errors and omissions excepted.
The author and FXStreet are not registered investment advisors and nothing in this article is intended to be investment advice.
Recommended Content
Editors’ Picks

EUR/USD remains side-lined around 1.0480
Price action in the FX world remains mostly subdued amid the lack of volatility and thin trade conditions following the US Presidents' Day holiday, with EUR/USD marginally down and flat-lined near 1.0480.

GBP/USD keeps the bullish bias above 1.2600
GBP/USD kicks off the new trading week on a positive foot and manages to reclaim the 1.2600 barrier and beyond on the back of the Greenback's steady price action.

Gold resumes the upside around $2,900
Gold prices leave behind Friday's marked pullback and regain some composure, managing to retest the $2,900 region per ounce troy amid the generalised absence of volatility on US Presidents' Day holiday.

Five fundamentals for the week: Peace talks, Fed minutes and German election stand out Premium
US President Donald Trump remains prominent, especially in a week when high-level peace talks kick off. Nevertheless, the Commander-in-Chief competes with the world's most powerful central bank, and other events are of interest as well.

Bitcoin Price Forecast: BTC stalemate soon coming to an end
Bitcoin price has been consolidating between $94,000 and $100,000 for almost two weeks. Amid this consolidation, investor sentiment remains indecisive, with US spot ETFs recording a $580.2 million net outflow last week, signaling institutional demand weakness.

The Best Brokers of the Year
SPONSORED Explore top-quality choices worldwide and locally. Compare key features like spreads, leverage, and platforms. Find the right broker for your needs, whether trading CFDs, Forex pairs like EUR/USD, or commodities like Gold.
