EUR/USD Current Price: 1.0956
View Live Chart for the EUR/USD
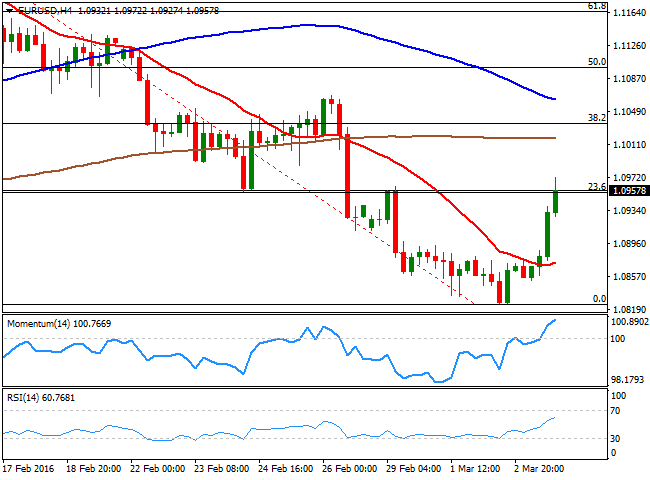
It was a bad day for the greenback this Thursday, as the American currency edged lower all across the board. After a soft start, the release of some disappointing macro figures, fueled the negative momentum of the currency, sending the EUR/USD pair up to 1.0972, its highest for the week. Services PMI in Germany and the euro area have bettered the preliminary readings for the month of February resulting at 55.3 and 53.3 respectively, whilst the EU Retail Sales surpassed initial forecasts during January, expanding 0.4% on a monthly basis and 2.0% over the last twelve months. In the US, however, news were not that encouraging, as weekly unemployment claims rose to 278K in the week ending February 26, while Factory Orders rose by 1.6%, below consensus and following a roughly 3% decline. The US ISM Non-Manufacturing Index pulled back slightly in February by printing 53.4, with the employment component falling into contraction territory, quite relevant ahead of the Nonfarm Payroll report, to be released this Friday.
In the meantime, the EUR/USD pair holds to its intraday gains and trades near the mentioned high, retaining a strong positive short term tone, given that in the 1 hour chart, the technical indicators maintain their bullish slopes, despite being in overbought territory, whilst the price is struggling to extend beyond its 200 SMA, for the first time since mid February. In the 4 hours chart, the technical picture also favors some additional gains, although the price is still not confirming a break above the 23.6% retracement of the latest daily decline, a handful of pips below the current level. If the US employment report disappoints this Friday, the pair can close the week above the 1.1000 figure, but gains will likely remain limited ahead of the next week ECB economic policy meeting.
Support levels: 1.0890 10845 1.0810
Resistance levels: 1.0925 1.0960 1.1000
EUR/JPY Current price: 124.33
View Live Chart for the EUR/JPY
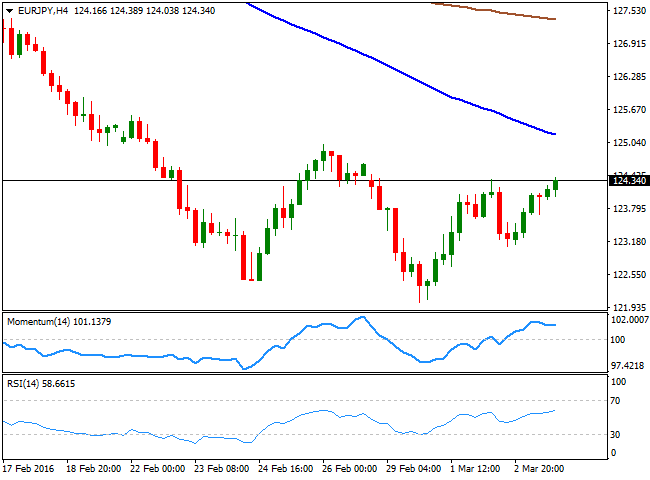
The EUR/JPY pair recovered the ground lost last Wednesday and is back pressuring its daily highs, boosted by EUR's demand. The Japanese yen saw limited strength against its major rivals, in spite of the poor performance of worldwide stocks, as risk sentiment has eased somehow on commodities' stability. Nearing the 124.40 region ahead of the close, the 1 hour chart shows that the technical indicators hold within positive territory, with only the RSI heading north towards overbought levels and indicating a possible upward continuation. In the same chart, the price has recovered above its moving averages, which anyway maintain bearish slopes. In the 4 hours chart, the price remains well below a bearish 100 SMA, currently around 125.20, while the technical indicators are resuming their advances well above their mid-lines, also suggesting further gains for this Friday.
Support levels: 124.10 123.65 123.20
Resistance levels: 124.40 124.80 125.20
GBP/USD Current price: 1.4150
View Live Chart for the GBP/USD
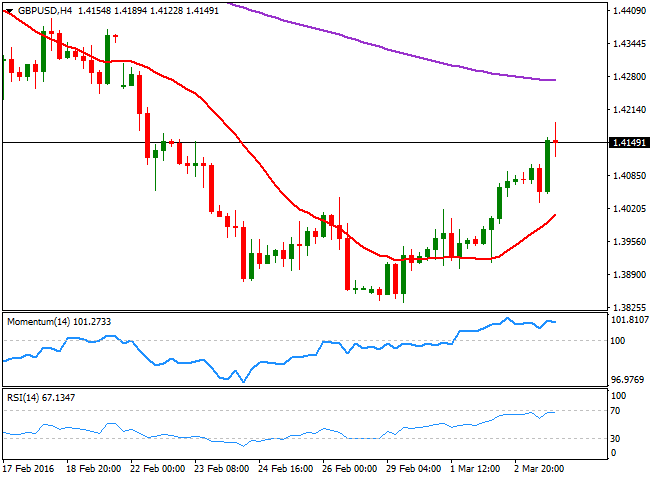
The Pound's recovery continued during this last session, and the GBP/USD pair reached 1.4189, its highest for the week. During the London session, the pair plummeted to 1.4030 as the UK service sector PMI fell by more than expected in February, giving further signs of a slowdown in the kingdom's economy. The headline index fell to 52.7 from 55.6 the previous month and also below the consensus forecast of 55.1. But speculative interest took their chances on the dip, as investors are starting to believe they overreacted to a possible Brexit. The pair seems to have posted an interim bottom around 1.3835 this week, and the recovery is poised to extend, according to intraday charts, although it will take some follow through beyond 1.4250 to confirm a steadier advance in the term. In the 1 hour chart, the technical indicators are resuming their advances near overbought territory, while the 20 SMA presents a strong bullish slope around 1.4090. In the 4 hours chart, the price is also well above a bullish 20 SMA, but the technical indicators have lost upward steam, and consolidate near overbought readings, rather suggesting some consolidation for the upcoming hours than suggesting a downward corrective movement under way.
Support levels: 1.4130 1.4085 1.4040
Resistance levels: 1.4185 1.4220 1.4250
USD/JPY Current price: 113.57
View Live Chart for the USD/JPY
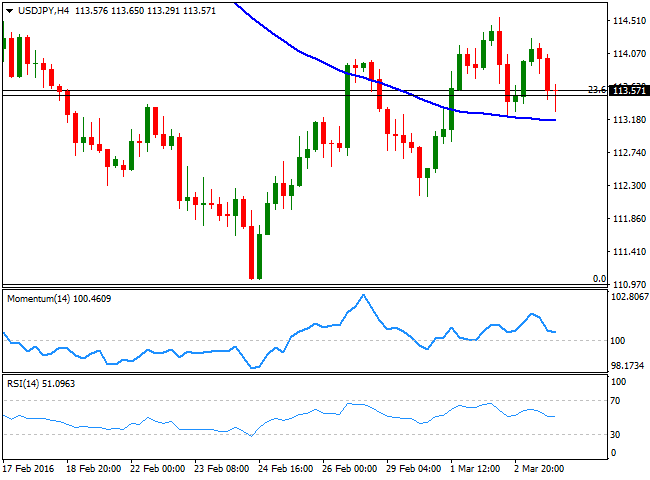
The USD/JPY pair erased most of its intraday gains after the release of soft US macroeconomic data, and trades back around the 113.50 region, the 23.6% retracement of its latest daily slump. The pair set a lower low daily basis, stalling its early rally around 114.26, having been unable to sustain gains beyond the 114.00 level. The pair will likely remain range bound during the upcoming Asian session, as investors will probably wait for the US Nonfarm Payroll report before placing their bets on the pair. Nevertheless, the technical picture is bearish, as only above 115.05, the 38.2% retracement of the same decline, the pair will be able to attract buying interest. Short term, the 1 hour chart shows that the technical indicators are losing bearish strength near oversold readings, giving no signs of an upward move during the upcoming hours. In the same chart, the 100 SMA converges with the mentioned 23.6% retracement, reinforcing the support area. In the 4 hours chart, the technical indicators retreated from their highs within positive territory, and turned flat above their mid-lines, supporting some further consolidation during the upcoming Asian session.
Support levels: 113.50 113.10 112.70
Resistance levels: 114.25 114.60 115.05
AUD/USD Current price: 0.7371
View Live Chart for the AUD/USD
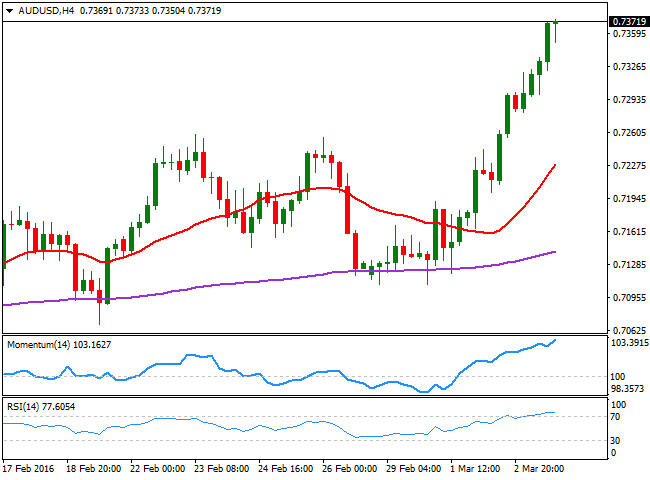
The Australian dollar outperformed its major rivals, soaring to a fresh 3-month high above 0.7370 against the greenback during the American afternoon, helped once again, but positive local data. According to the official release, the January Trade Balance showed a deficit of A$2.94B, much better than the A$3.2B decline expected. Exports surged by 1.0%, while imports decline by the same amount, this last due to lower oil's prices. Nevertheless, the pair retains a strong upward tone, but stalled around a major resistance, the 0.7380 region, from where the pair was rejected twice, during October, and December of 2015. In the short term, the 1 hour chart shows that the 20 SMA maintains a strong upward tone below the current level, while the technical indicators have lost their upward strength near overbought levels, but with the price holding near its daily high, chances of a downward correction are quite limited. In the 4 hours chart, the Momentum indicator has resumed its advance in extreme overbought territory, while the RSI indicator hovers around 77, also suggesting bearish chances are limited, even as a bare correction.
Support levels: 0.7350 0.7310 0.7280
Resistance levels: 0.7380 0.7415 0.7450
Information on these pages contains forward-looking statements that involve risks and uncertainties. Markets and instruments profiled on this page are for informational purposes only and should not in any way come across as a recommendation to buy or sell in these assets. You should do your own thorough research before making any investment decisions. FXStreet does not in any way guarantee that this information is free from mistakes, errors, or material misstatements. It also does not guarantee that this information is of a timely nature. Investing in Open Markets involves a great deal of risk, including the loss of all or a portion of your investment, as well as emotional distress. All risks, losses and costs associated with investing, including total loss of principal, are your responsibility. The views and opinions expressed in this article are those of the authors and do not necessarily reflect the official policy or position of FXStreet nor its advertisers. The author will not be held responsible for information that is found at the end of links posted on this page.
If not otherwise explicitly mentioned in the body of the article, at the time of writing, the author has no position in any stock mentioned in this article and no business relationship with any company mentioned. The author has not received compensation for writing this article, other than from FXStreet.
FXStreet and the author do not provide personalized recommendations. The author makes no representations as to the accuracy, completeness, or suitability of this information. FXStreet and the author will not be liable for any errors, omissions or any losses, injuries or damages arising from this information and its display or use. Errors and omissions excepted.
The author and FXStreet are not registered investment advisors and nothing in this article is intended to be investment advice.
Recommended Content
Editors’ Picks

EUR/USD recovers toward 1.0500 after mixed US PMI data
EUR/USD rebounds toward 1.0500 in the American session on Friday after the data from the US showed that the business activity in the private sector expanded at a softer pace than anticipated in early February. The pair remains on track to end the week with little changed.

GBP/USD rises above 1.2650, looks to post weekly gains
GBP/USD regains its traction and trades above 1.2650 in the second half of the day on Friday. The data from the US showed that the S&P Global Services PMI dropped into the contraction territory below 50 in February, causing the US Dollar to lose strength and helping the pair edge higher.

Gold holds above $2,930 as US yields edge lower
Gold holds above $2,930 after correcting from the record-high it set above $2,950 on Thursday. Following the mixed PMI data from the US, the benchmark 10-year US Treasury bond yield stays in negative territory below 4.5% and allows XAU/USD to hold its ground.

Crypto exchange Bybit hacked for $1.4 billion worth of ETH
Following a security breach first spotted by crypto investigator ZachXBT, crypto exchange Bybit announced that it suffered a hack where an attacker compromised one of its ETH wallets.

Money market outlook 2025: Trends and dynamics in the Eurozone, US, and UK
We delve into the world of money market funds. Distinct dynamics are at play in the US, eurozone, and UK. In the US, repo rates are more attractive, and bills are expected to appreciate. It's also worth noting that the Fed might cut rates more than anticipated, similar to the UK. In the eurozone, unsecured rates remain elevated.

The Best brokers to trade EUR/USD
SPONSORED Discover the top brokers for trading EUR/USD in 2025. Our list features brokers with competitive spreads, fast execution, and powerful platforms. Whether you're a beginner or an expert, find the right partner to navigate the dynamic Forex market.
