EUR/USD Current Price: 1.0923
View Live Chart for the EUR/USD
Markets resumed their risk-averse trading this Wednesday, with oil plummeting to fresh lows and the DJIA losing over 500 points in the American afternoon. Safe havens gold and yen were among the most favored, whilst the common currency also benefited from the risk environment, although traded within its recent range ahead against the greenback, ahead of the ECB economic policy meeting early Thursday. Stock's rout began in Asia, as local shares succumbed to selling pressure following black gold´s decline to fresh multi-year lows, and extended all through the world, with all of the major indexes closing in the red. The dollar also suffered from poor local data, as housing starts in the US, unexpectedly fell by 2.5% in December, whilst inflation faltered in the same month, as December monthly CPI fell to -0.1%.
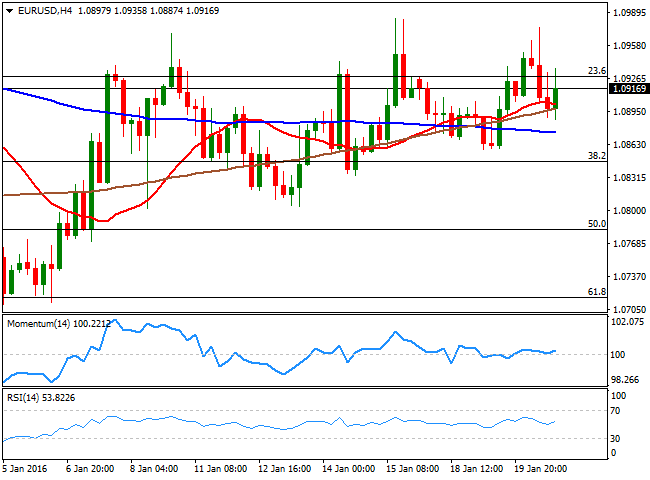
The EUR/USD pair, however, was unable to set a clear directional strength, and wavered between 1.0887 and 1.0975, ahead of the ECB economic policy meeting, scheduled for this Thursday. The ECB is expected to maintain its status quo, which means it will on depend on Draghi, and his latest asset of the ongoing situation, alongside with any tip he may give on upcoming decisions. Expectations are of a dovish stance, and of the Government Council leaving doors open for further easing, which may end up favoring the EUR. In the meantime, the technical picture is still neutral, given that the pair is hardly changed from Tuesday's close. The 4 hours chart shows that the price has managed to hold above the congestion of moving averages, whilst the technical indicators are above their mid-lines, but neither has enough momentum to support further gains. The pair has been well contained within 1.0800 and 1.1000 and a break of any of those extremes is required to establish a clearer directional strength from there on.
Support levels: 1.0880 1.0845 1.0800
Resistance levels: 1.0930 1.0965 1.1000
EUR/JPY Current price: 127.16
View Live Chart for the EUR/JPY
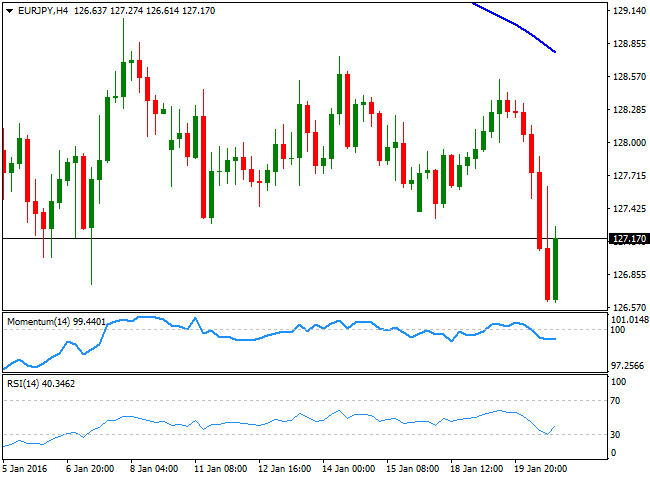
The EUR/JPY pair plummeted to 126.61, as the Japanese yen surged sharply at the beginning of the day, tracking the slide in the Nikkei, which lost over 600 points and closed at its lowest in two years. The pair bounce late London session, as a Japanese official said that they are closely watching currency markets, but the recovery was limited by former lows in the 127.30 region. The pair holds to its long term bearish bias, and the 1 hour chart maintains the risk towards the downside, given that the technical indicators are turning back south after correcting oversold readings, while the price is far below the 100 and 200 SMAs, both converging in the 127.90 region. In the 4 hours chart, the Momentum indicator lacks direction below the 100 level, while the RSI indicator bounced from oversold territory, but remains around 40, far from suggesting additional gains at the time being. 2015 low posted last April comes at 126.08 and a break below it should lead to some panic selling, with the market then eyeing 124.40, a strong midterm static support.
Support levels: 126.90 126.50 126.05
Resistance levels: 127.30 127.75 128.10
GBP/USD Current price: 1.4175
View Live Chart for the GBP/USD
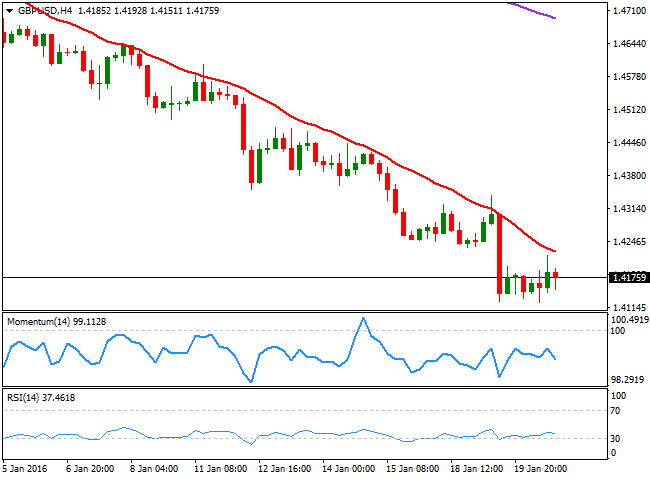
The GBP/USD pair consolidated its latest losses, extending its decline by a few pips to fresh multi-year lows at 1.4124. Pound continues unable to attract buying interest, even despite the release of the latest UK employment report showed that unemployment level fell down to 5.1%, its lowest since early 2016. The number of people unemployed decreased by more than expected, albeit wages disappointed, growing below market's expectations. A bottom is still unclear, given that the pair has set a lower low and a lower high daily basis, but an upward corrective movement can't be dismissed for this Thursday, considering that the pair accumulates nearly 800 pips of steady decline. Short term, the 1 hour chart shows that the price is a handful of pips above a flat 20 SMA, while the technical indicators have turned south around their mid-lines. In the 4 hours chart, the 20 SMA continues leading the way lower, as an approach to it again resulted in a downward move, now acting as dynamic resistance around 1.4220, while in the same chart, the technical indicators have resumed their declines within bearish territory, in line with the dominant bearish trend.
Support levels: 1.4125 1.4080 1.4030
Resistance levels: 1.4220 1.4250 1.4290
USD/JPY Current price: 116.48
View Live Chart for the USD/JPY
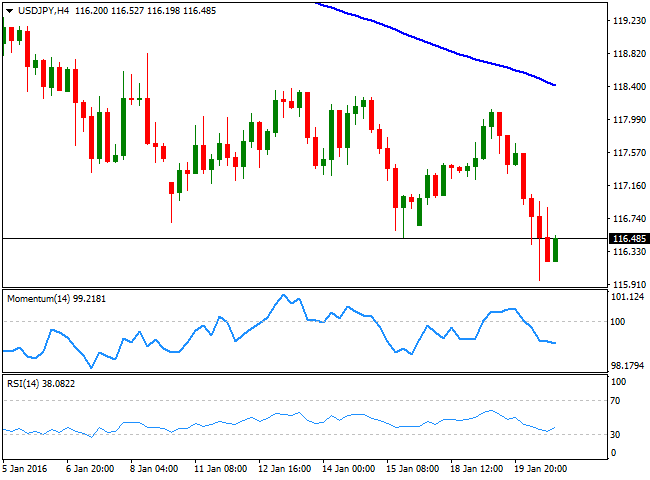
The USD/JPY pair plummeted to 115.96 during the London session, following the decline in worldwide stocks, triggered by a continued slide of oil prices and fears over Chinese liquidity in the market after the Shanghai Composite fell again. The pair bounced sharply higher on some verbal intervention coming from a government official, claiming that the Central Bank is keeping an eye on currencies developments, but the pair resumed its slide in the US session as US indexes plummeted. Closing at its lowest in almost a year, the USD/JPY pair bearish trend remains firm in place, and considering the current environment, the pair will likely resume its slide with Tokyo opening. In the meantime the 1 hour chart shows that the 100 and 200 SMAs are gaining bearish slope far above the current level, while the technical indicators have corrected extreme oversold readings, but are actually losing upward strength within bearish territory. In the 4 hours chart, the Momentum indicator heads south below its 100 level whilst the RSI indicator hovers around 38 as the price holds far below its moving averages, all of which supports a bearish breakout for this Thursday.
Support levels: 116.40 115.95 115.50
Resistance levels: 117.00 117.35 117.70
AUD/USD Current price: 0.6887
View Live Chart for the AUD/USD
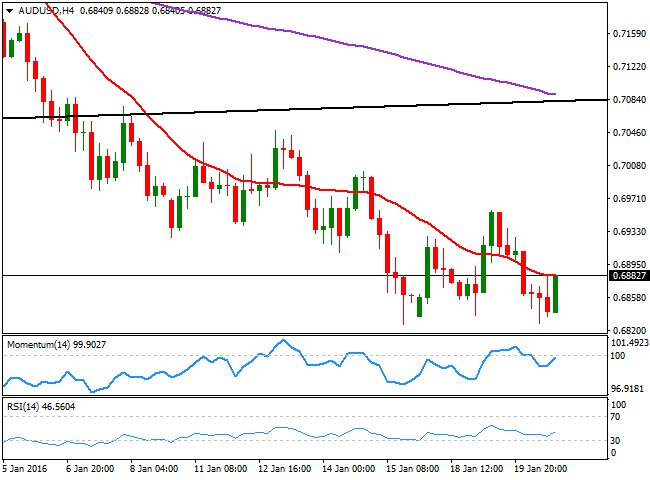
The AUD/USD pair erased most of its intraday losses in the US afternoon, but not before flirting with the 0.6820 region, levels last seen in March 2009. The pair traded alongside with sentiment, and recovered as Wall Street pared losses temporarily, but remained within bearish territory, far below the 0.7000 level, a line in the sand for bears. The pair may have established a short term double bottom at the mentioned lows, although the neckline comes at 0.6957, the weekly high, which means some follow through beyond this last is required to confirm the figure. Technically, the short term picture is bullish as in the 1 hour chart, the price is accelerating above its 20 SMA whilst the technical indicators head higher above their mid-lines. In the 4 hours chart, the price is struggling to overcome a flat 20 SMA while the technical indicators are aiming to cross their mid-lines towards the upside.
Support levels: 0.6860 0.6825 0.6770
Resistance levels: 0.6910 0.6960 0.7000
Information on these pages contains forward-looking statements that involve risks and uncertainties. Markets and instruments profiled on this page are for informational purposes only and should not in any way come across as a recommendation to buy or sell in these assets. You should do your own thorough research before making any investment decisions. FXStreet does not in any way guarantee that this information is free from mistakes, errors, or material misstatements. It also does not guarantee that this information is of a timely nature. Investing in Open Markets involves a great deal of risk, including the loss of all or a portion of your investment, as well as emotional distress. All risks, losses and costs associated with investing, including total loss of principal, are your responsibility. The views and opinions expressed in this article are those of the authors and do not necessarily reflect the official policy or position of FXStreet nor its advertisers. The author will not be held responsible for information that is found at the end of links posted on this page.
If not otherwise explicitly mentioned in the body of the article, at the time of writing, the author has no position in any stock mentioned in this article and no business relationship with any company mentioned. The author has not received compensation for writing this article, other than from FXStreet.
FXStreet and the author do not provide personalized recommendations. The author makes no representations as to the accuracy, completeness, or suitability of this information. FXStreet and the author will not be liable for any errors, omissions or any losses, injuries or damages arising from this information and its display or use. Errors and omissions excepted.
The author and FXStreet are not registered investment advisors and nothing in this article is intended to be investment advice.
Recommended Content
Editors’ Picks

AUD/USD: Extra gains need to clear 0.6400
AUD/USD rose for the third day in a row, approaching the key 0.6400 resistance on the back of the acute pullback in the US Dollar amid mounting recession concerns and global trade war fear.

EUR/USD: Powell and the NFP will put the rally to the test
EUR/USD gathered extra steam and advanced to multi-month peaks near 1.1150, although the move fizzled out somewhat as the NA session drew to a close on Thursday.

Gold looks offered near $3,100
Prices of Gold remain on the defensive on Thursday, hovering around the $3,100 region per troy ounce and retreating from earlier all-time peaks near the $3,170 level, all against the backdrop of investors' assessment of "Liberation Day".

Interoperability protocol hyperlane reveals airdrop details
The team behind interoperability protocol Hyperlane shared their upcoming token airdrop plans happening at the end of the month. The airdrop will occur on April 22, and users can check their eligibility to receive $HYPER tokens via a portal provided by the Hyperlane Foundation by April 13, the team shared in a press release with CoinDesk.

Trump’s “Liberation Day” tariffs on the way
United States (US) President Donald Trump’s self-styled “Liberation Day” has finally arrived. After four straight failures to kick off Donald Trump’s “day one” tariffs that were supposed to be implemented when President Trump assumed office 72 days ago, Trump’s team is slated to finally unveil a sweeping, lopsided package of “reciprocal” tariffs.

The Best brokers to trade EUR/USD
SPONSORED Discover the top brokers for trading EUR/USD in 2025. Our list features brokers with competitive spreads, fast execution, and powerful platforms. Whether you're a beginner or an expert, find the right partner to navigate the dynamic Forex market.
