EUR/USD Current price: 1.0967
View Live Chart for the EUR/USD
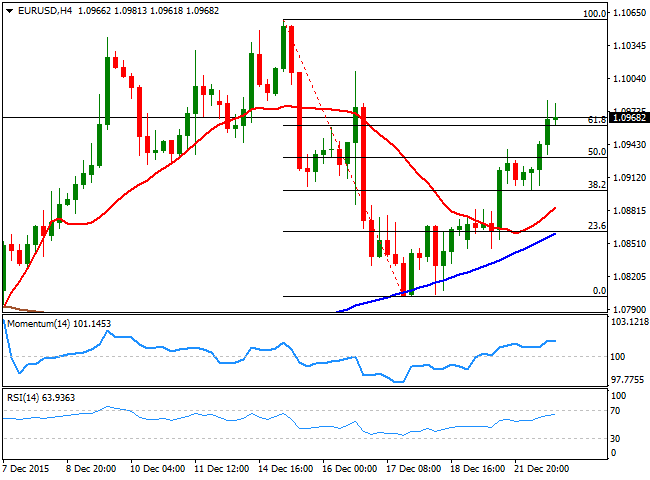
The common currency advanced against the greenback for a third day in-a-row, extending up to 1.0983, its highest in almost a week. The macroeconomic calendar was pretty busy as Germany released its CFK consumer confidence survey, finally up after 4 straight declines, while in the third quarter, import prices decreased by 3.5% in November 2015, less than expected and compared with the corresponding month of the preceding year. The first round of US data was relatively positive, with the final revision of the US third quarter GDP resulting at 2.0%, and core personal consumption expenditure beating expectations. Yet housing data was again a miss, as the US existing home sales dropped in November to the slowest pace in 19 month, falling by 10.5%, pushing the dollar further lower against the EUR.
The pair holds near its recent high and presents a short term positive tone, as in the 1 hour chart shows that the price rallied above its moving averages, with the 20 SMA maintaining its upward slope after extending above the 100 and 200 SMAs, although the technical indicators are giving sings of exhaustion in overbought territory. In the 4 hours chart, the latest candle has opened above the 61.8% retracement of the latest daily decline, while the price has also advanced beyond a now bullish 20 SMA, while the technical indicators are losing their upward strength above their mid-lines, in line with the shorter term outlook.
Support levels: 1.0955 1.0915 1.0880
Resistance levels: 1.1000 1.1045 1.1090
EUR/JPY Current price: 132.69
View Live Chart for the EUR/JPY
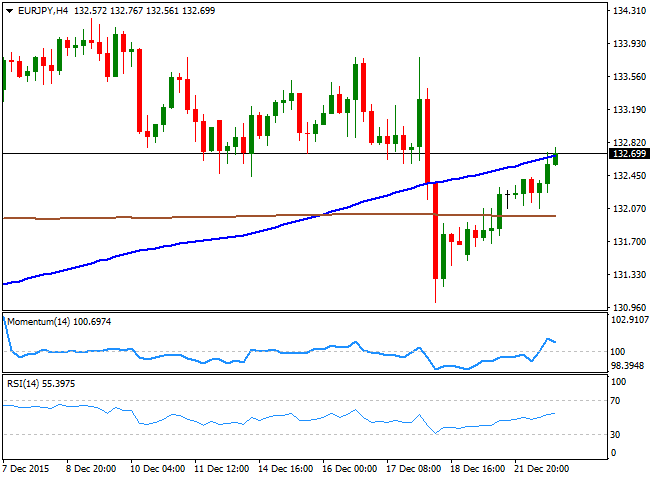
The EUR/JPY advanced as the common currency trades generally higher against its major rivals, with the pair having erased almost all of its Friday's losses, triggered by the BOJ. The Japanese yen has held quite a neutral stance this Tuesday, and will likely remain so, as Japanese banks will be closed in observance of The Emperor's Birthday. Technically speaking and in the short term, the pair has advanced up to its 200 SMA in the hourly chart, now containing rallies with its bearish slope, while the technical indicators are turning slightly lower above their mid-lines. In the same chart the 100 SMA heads lower below the current price, providing an immediate support at 132.40. In the 4 hours chart, the price is struggling around a bullish 100 SMA, still unable to break above it, while the Momentum indicator turns south in positive territory and the RSI maintains its bullish slope around 55, all of which should help in keeping the downside limited.
Support levels: 132.40 131.95 131.50
Resistance levels: 132.80 133.30 133.80
GBP/USD Current price: 1.4810
View Live Chart for the GPB/USD
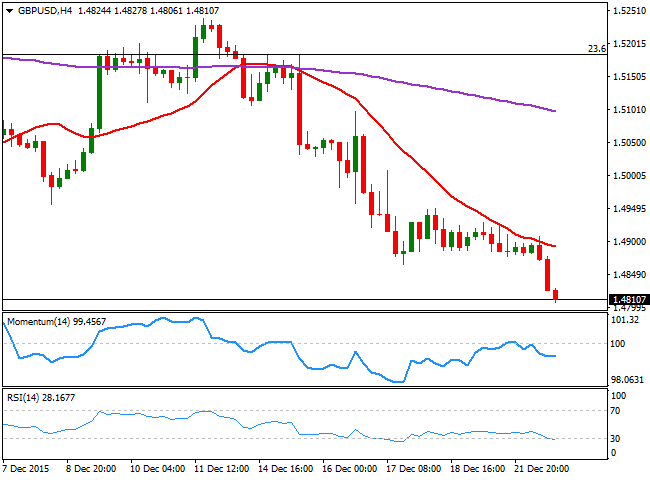
The GBP/USD pair has extended its decline further, reaching a fresh 8-month low of 1.4806 and holding nearby by the end of the day. There were no catalyst behind the movement, although data released in the UK was soft with public sector net borrowing excluding public sector banks increased by £1.3 billion to £14.2 billion in November 2015 compared with November 2014. The decline in the Pound however, extended despite broad dollar weakness during the American afternoon, and the 1 hour chart points for further declines as the technical indicators have corrected within oversold territory before turning back lower, while the 20 SMA gains bearish slope above the current level. In the 4 hours chart, the RSI indicator anticipates some additional declines by heading lower around 27, while the 20 SMA contained advances for one more day, and stands now around the 1.4890 level.
Support levels: 1.4790 1.4760 1.4735
Resistance levels: 1.4855 1.4890 1.4920
USD/JPY Current price: 121.00
View Live Chart for the USD/JPY
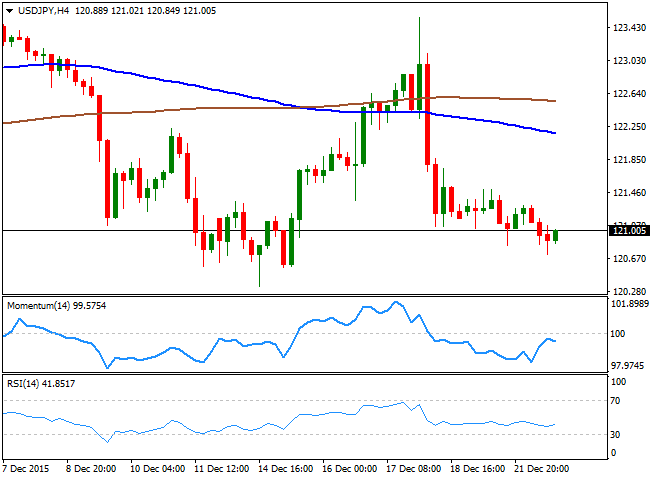
The USD/JPY pair edged lower this Tuesday, having extended its weekly decline by a few pips, reaching 120.71 before finally bouncing some. The pair has been developing a tepid bearish continuation ever since the Bank of Japan announced some changes to its facilities program, in a desperate attempt of boosting inflation, which resulted in a strong Japanese yen rally across the board. Ahead of the Asian opening, the short term picture is bearish as the price is still well below its 100 and 200 SMA, while the technical indicators are heading slightly higher below their mid-lines, following the latest recovery rather than suggesting a stronger advance. In the 4 hours chart, the bearish potential remains intact as the 100 SMA is accelerating below the 200 SMA, both well above the current level, while he Momentum indicator is turning south below the 100 level and the RSI indicator hovers around 42.
Support levels: 120.70 120.35 119.90
Resistance levels: 121.40 121.70 122.20
AUD/USD Current price: 0.7230
View Live Chart for the AUD/USD
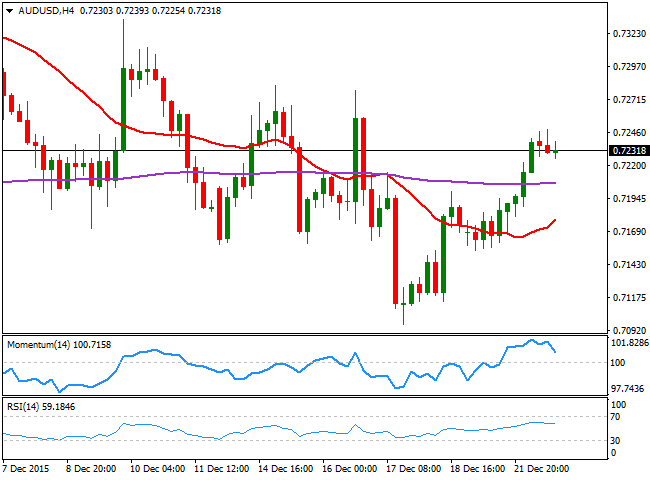
The Australian dollar has advanced up to 0.7248 against the greenback, with the Antipodean currency finding demand early Asia, following the sharp rally posted Monday by base metals. The AUD/USD pair, however, was unable to sustain gains above .7240, a strong static resistance level, and eased some before the closing bell, mostly due to the lack of volumes across the financial word and ahead of the Christmas holidays which will keep most financial markets closed since mid Thursday. From a technical point of view, the pair is poised to continue easing, as in the 1 hour chart, the price is about to break below its 20 SMA, while the technical indicators continue retreating from overbought readings, and remain within positive territory. In the 4 hours chart, the Momentum indicator has turned sharply lower, still holding above its 100 level, while the RSI indicator heads lower around 58 and the 20 SMA continues heading higher far below the current level, around 0.7165.
Support levels: 0.7200 0.7165 0.7120
Resistance levels: 0.7240 0.7280 0.7330
Information on these pages contains forward-looking statements that involve risks and uncertainties. Markets and instruments profiled on this page are for informational purposes only and should not in any way come across as a recommendation to buy or sell in these assets. You should do your own thorough research before making any investment decisions. FXStreet does not in any way guarantee that this information is free from mistakes, errors, or material misstatements. It also does not guarantee that this information is of a timely nature. Investing in Open Markets involves a great deal of risk, including the loss of all or a portion of your investment, as well as emotional distress. All risks, losses and costs associated with investing, including total loss of principal, are your responsibility. The views and opinions expressed in this article are those of the authors and do not necessarily reflect the official policy or position of FXStreet nor its advertisers. The author will not be held responsible for information that is found at the end of links posted on this page.
If not otherwise explicitly mentioned in the body of the article, at the time of writing, the author has no position in any stock mentioned in this article and no business relationship with any company mentioned. The author has not received compensation for writing this article, other than from FXStreet.
FXStreet and the author do not provide personalized recommendations. The author makes no representations as to the accuracy, completeness, or suitability of this information. FXStreet and the author will not be liable for any errors, omissions or any losses, injuries or damages arising from this information and its display or use. Errors and omissions excepted.
The author and FXStreet are not registered investment advisors and nothing in this article is intended to be investment advice.
Recommended Content
Editors’ Picks

AUD/USD: Extra gains need to clear 0.6400
AUD/USD rose for the third day in a row, approaching the key 0.6400 resistance on the back of the acute pullback in the US Dollar amid mounting recession concerns and global trade war fear.

EUR/USD: Powell and the NFP will put the rally to the test
EUR/USD gathered extra steam and advanced to multi-month peaks near 1.1150, although the move fizzled out somewhat as the NA session drew to a close on Thursday.

Gold looks offered near $3,100
Prices of Gold remain on the defensive on Thursday, hovering around the $3,100 region per troy ounce and retreating from earlier all-time peaks near the $3,170 level, all against the backdrop of investors' assessment of "Liberation Day".

Interoperability protocol hyperlane reveals airdrop details
The team behind interoperability protocol Hyperlane shared their upcoming token airdrop plans happening at the end of the month. The airdrop will occur on April 22, and users can check their eligibility to receive $HYPER tokens via a portal provided by the Hyperlane Foundation by April 13, the team shared in a press release with CoinDesk.

Trump’s “Liberation Day” tariffs on the way
United States (US) President Donald Trump’s self-styled “Liberation Day” has finally arrived. After four straight failures to kick off Donald Trump’s “day one” tariffs that were supposed to be implemented when President Trump assumed office 72 days ago, Trump’s team is slated to finally unveil a sweeping, lopsided package of “reciprocal” tariffs.

The Best brokers to trade EUR/USD
SPONSORED Discover the top brokers for trading EUR/USD in 2025. Our list features brokers with competitive spreads, fast execution, and powerful platforms. Whether you're a beginner or an expert, find the right partner to navigate the dynamic Forex market.
