EUR/USD Current price: 1.1169
View Live Chart for the EUR/USD
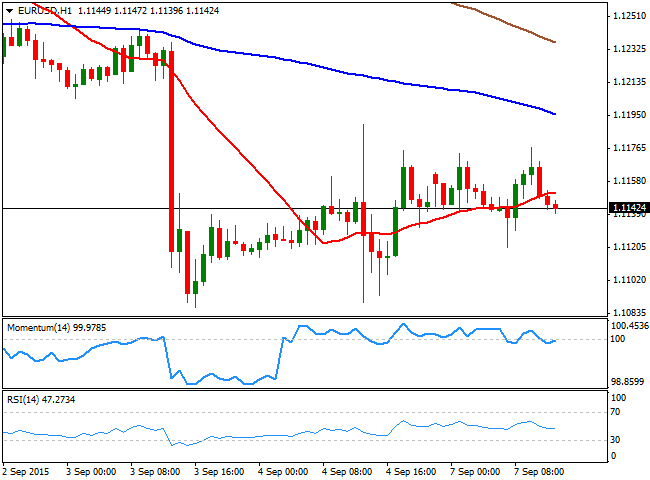
Monday saw majors trading in quite limited ranges, with low trading volumes amid the US and Canada being closed on a local holiday. There were some macroeconomic news in Europe, but those had little effect among investors, who remained side-lined ahead of more relevant news worldwide, later on this week. The most relevant piece of news in the EU was the Sentix confidence index that fell down to 13.6 from previous 18.4 and well below the 18.4 expected, clearly reflecting the local concerns over the Chinese economic slowdown spreading worldwide.
The EUR/USD pair traded higher in range, finding short term buying interest on an approach to the 1.1120 level at the beginning of the London session, as local share markets opened with a positive tone. Nevertheless, the pair was unable to advance beyond 1.1177, the daily high posted afterwards, ending the day a handful of pips above its opening. Technically, the 1 hour chart shows that the price is slightly above a mild bullish 20 SMA, whilst the technical indicators hold above their mid-lines, lacking upward strength. In the same chart, the 100 SMA heads lower around 1.1190, providing an immediate intraday resistance for this Tuesday. In the 4 hours chart, the technical picture is slightly positive, as the technical indicators head higher after crossing their midlines towards the upside, whilst the latest candle opened above the 20 SMA. Nevertheless, the price needs to advance beyond the mentioned 1.1190 level, also Friday's high, to confirm additional gains during the upcoming sessions, whilst below 1.1120 the risk will turn towards the downside.
Support levels: 1.1120 1.1080 1.1050
Resistance levels: 1.1190 1.1230 1.1265
EUR/JPY Current Price: 133.31
View Live Chart for the EUR/JPY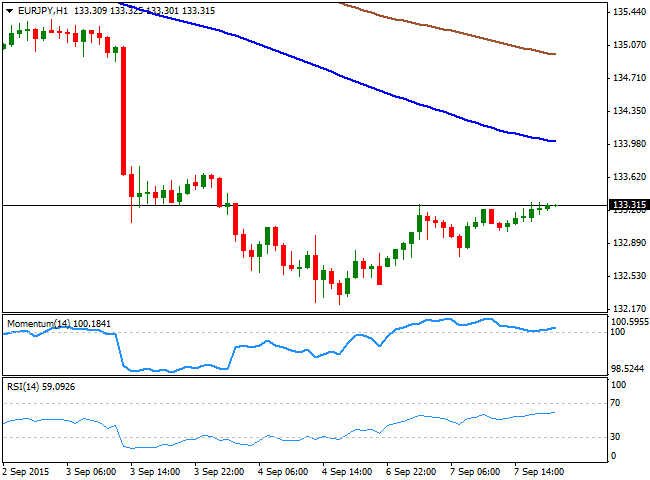
The EUR/JPY pair closed with gains around 133.30, having corrected partially last week's decline, but far from reverting the negative tone seen on the last updates. The advance was supported by the limited EUR's demand, and the 1 hour chart shows that the pair remains well below its moving averages, with the 100 SMA providing a strong resistance around 134.00 for this Tuesday. In the same chart, the Momentum indicator is aiming to bounce from the 100 level whilst the RSI indicator holds around 59, limiting the downside in the short term. In the 4 hours chart, the Momentum indicator heads sharply higher, but is still below its 100 level, whilst the RSI is losing its upward strength around 42, far from confirming further advances. Friday's high of 133.66 is the level to watch, as it will take a break above it to support additional gains during the upcoming sessions.
Support levels: 132.80 132.20 131.75
Resistance levels: 133.65 134.10 134.60
GBP/USD Current price: 1.5284
View Live Chart for the GPB/USD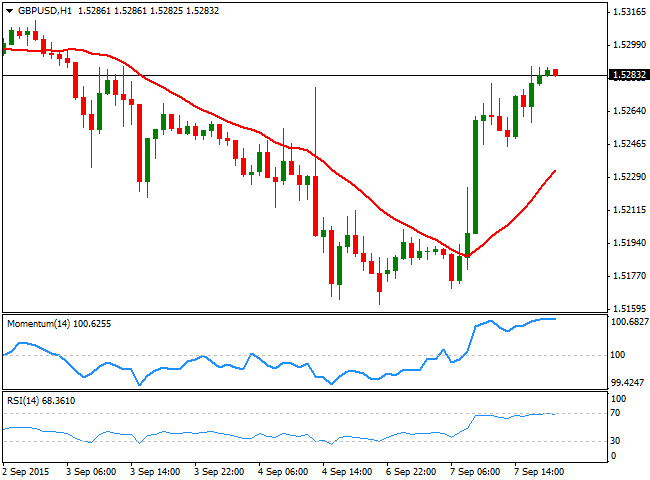
The GBP/USD pair advanced over 100 pips from its Friday's close, with no certain catalyst behind the move, as there were no fundamental releases in the UK, and the US markets were down on holidays. The movement seems mostly the due correction after the pair fell steadily during the last two weeks, with the pair reaching extreme oversold readings in almost every intraday time frame. The release however, can be temporal ahead of two major risk events in the UK later on this week, the release of a GDP estimate, and the BOE monthly meeting. Anyway, the pair is closing the day a handful of pips below the 1.5300 figure and the 1 hour chart shows that the price holds well above a bullish 20 SMA, although the technical indicators are giving signs of upward exhaustion in overbought territory. In the 4 hours chart, however, the upside seems more constructive, as the price is advancing above its 20 SMA for the first time since August 25th, whilst the Momentum indicator continues heading higher above the 100 level and the RSI indicator aims slightly higher around 53, supporting further advances, particularly if the pair manages to settle above the 1.5300 level.
Support levels: 1.5260 1.5220 1.5170
Resistance levels: 1.5310 1.5350 1.5390
USD/JPY Current price: 119.35
View Live Chart for the USD/JPY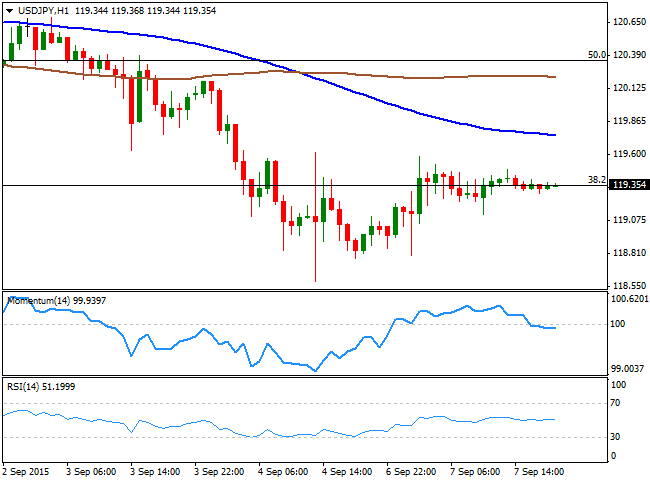
The American dollar posted some tepid gains against its Japanese rival, with the JPY down on tepid local data and a generally positive mood amongst worldwide investors. The Japan's leading index declined as expected to 104.9 in July, from 106.5 in June. This was the lowest reading since March, when the score was 103.9, and adds to concerns over the local economic recovery. The pair fell briefly below the 119.00 level at the beginning of the day, but buying interest pushed the pair back higher, up to a daily high of 1119.58. Nevertheless, the pair was unable to extend its gains and remained stuck around 119.35, the 38.25 retracement of the latest weekly decline. Short term, the 1 hour chart continues to favor the downside, as the price develops well below its 100 and 200 SMAs, with the shortest now providing a dynamic resistance, whilst the technical indicators present a mild negative tone in neutral territory. In the 4 hours chart, the technical indicators also lack directional strength, but remain below their mid-lines, whilst the 100 SMA extended its decline well above the current level, converging with the 61.8% retracement of the same rally around 121.30.
Support levels: 118.90 118.60 118.25
Resistance levels: 119.70 120.00 120.40
AUD/USD Current price: 0.6927
View Live Chart for the AUD/USD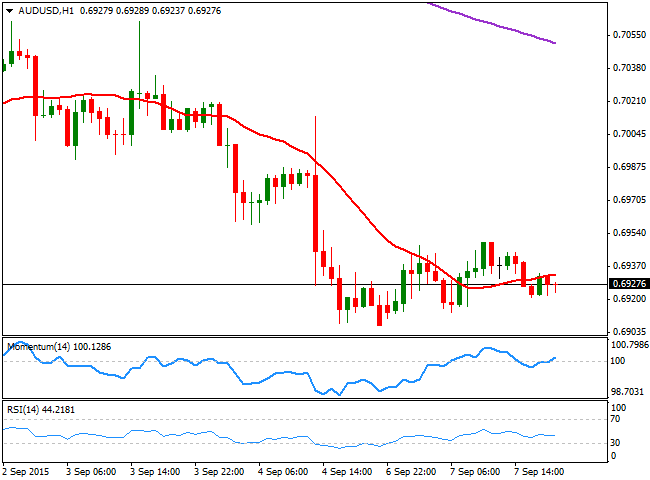
The AUD/USD pair consolidated near its multi-year lows this Monday, closing the day some 30 pips above the 0.6900 level. Australia will release the NAB's business indicators during the upcoming Asian session, whilst China will release its latest Trade Balance figure, all of which will likely affect the Aussie. Should Chinese data disappoint, the pair can break below the 0.6900 level and accelerate its decline down to the 0.6800 region. Technically, the 1 hour chart shows that the price is hovering around a flat 20 SMA, whilst the Momentum indicator heads higher right above the 100 level, but the RSI indicator turned lower around 44, anticipating a bearish continuation. In the 4 hours chart, the 20 SMA maintains a strong bearish slope, providing a strong dynamic intraday resistance around 0.6970, whilst the technical indicators have turned south well below their mid-lines, maintaining the risk towards the downside.
Support levels: 0.6900 0.6870 0.6845
Resistance levels: 0.6945 0.6970 0.7010
Recommended Content
Editors’ Picks

EUR/USD hits two-week tops near 1.0500 on poor US Retail Sales
The selling pressure continues to hurt the US Dollar and now encourages EUR/USD to advance to new two-week peaks in levels just shy of the 1.0500 barrier in the wake of disappointing results from US Retail Sales.

GBP/USD surpasses 1.2600 on weaker US Dollar
GBP/USD extends its march north and reclaims the 1.2600 hurdle for the first time since December on the back of the increasing downward bias in the Greenback, particularly exacerbated following disheartening US results.

Gold maintains the bid tone near $2,940
The continuation of the offered stance in the Greenback coupled with declining US yields across the board underpin the extra rebound in Gold prices, which trade at shouting distance from their record highs.

Weekly wrap: XRP, Solana and Dogecoin lead altcoin gains on Friday
XRP, Solana (SOL) and Dogecoin (DOGE) gained 5.91%, 2.88% and 3.36% respectively on Friday. While Bitcoin (BTC) hovers around the $97,000 level, the three altcoins pave the way for recovery and rally in altcoins ranking within the top 50 cryptocurrencies by market capitalization on CoinGecko.

Tariffs likely to impart a modest stagflationary hit to the economy this year
The economic policies of the Trump administration are starting to take shape. President Trump has already announced the imposition of tariffs on some of America's trading partners, and we assume there will be more levies, which will be matched by foreign retaliation, in the coming quarters.

The Best Brokers of the Year
SPONSORED Explore top-quality choices worldwide and locally. Compare key features like spreads, leverage, and platforms. Find the right broker for your needs, whether trading CFDs, Forex pairs like EUR/USD, or commodities like Gold.