EUR/USD Current price: 1.1258
View Live Chart for the EUR/USD
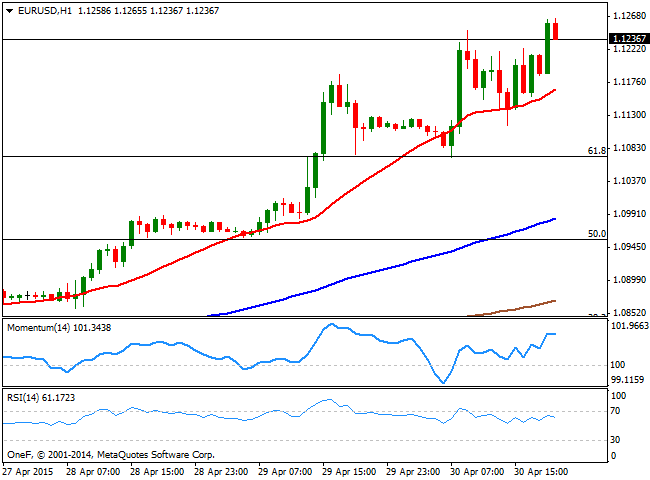
The dollar ended the day mixed across the board, with the EUR being among the best daily performers, as the EUR/USD pair advanced up to 1.1248, a fresh 2-month high in the European opening. There were several relevant macroeconomic releases all through the day among which the most notable were the EU inflation that printed 0.0% yearly basis in April, against previous -0.1%, whilst the unemployment rate in the region held a 11.3% against expectations of a decline towards 11.2%. German Retail Sales dropped 2.3% in March, but the year-on-year reading beat expectations, up to 3.5%. The upward momentum in the common currency, had little to do with fundamentals, mostly related to the technical breakout higher. In the US, unemployment weekly claims for last week printed 262K better than the 290K expected, whilst the Chicago PMI ticked higher up to 52.3 in April. Finally, consumer spending surged 0.4%, against expectations of a 0.5% advance, although incomes remained flat. Late in the US session, the pair extended its advance up to 1.1265 as Wall Street tumbled before the closing bell.
The market took positively US figures, pushing the dollar higher mid American session, albeit EUR/USD buyers surged around the key 1.1120 Fibonacci support, pushing the pair back higher. Technically, the 1 hour chart shows that the price consolidates above a bullish 20 SMA, whilst the technical indicators head higher above their mid-lines after correcting overbought readings earlier in the day. In the 4 hours chart the 20 SMA heads sharply higher around 1.1030 now, whilst the technical indicators remain in extreme overbought territory, far from suggesting a downward correction ahead. Renewed buying interest above 1.1240 should lead to additional advances towards fresh highs in the 1.1300 region.
Support levels: 1.1200 1.1160 1.1120
Resistance levels: 1.1260 1.1300 1.1350
EUR/JPY Current price: 134.10
View Live Chart for the EUR/JPY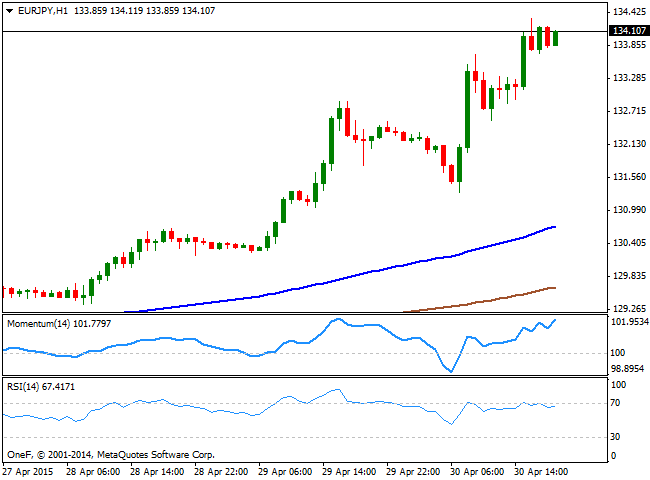
The EUR/JPY added almost 200 pips this Thursday, as better-than-expected US data weakened the Japanese currency, whilst the EUR advanced on its own. The pair has reached a daily high of 134.32, a few pips below March one at 134.59, now the key level to overcome to confirm additional advances. Technically, the 1 hour chart shows that the Momentum indicator heads sharply higher in extreme overbought levels, whilst the RSI also heads higher near 70, as the price advances well above its moving averages. In the 4 hours chart the technical indicators are looking exhausted in overbought territory, but far from supporting a downward corrective movement. Overall, the upside remains favored, with a break above the mentioned confirming the bullish continuation.
Support levels: 133.70 133.30 132.90
Resistance levels: 134.60 135.10 135.70
GBP/USD Current price: 1.5335
View Live Chart for the GBP/USD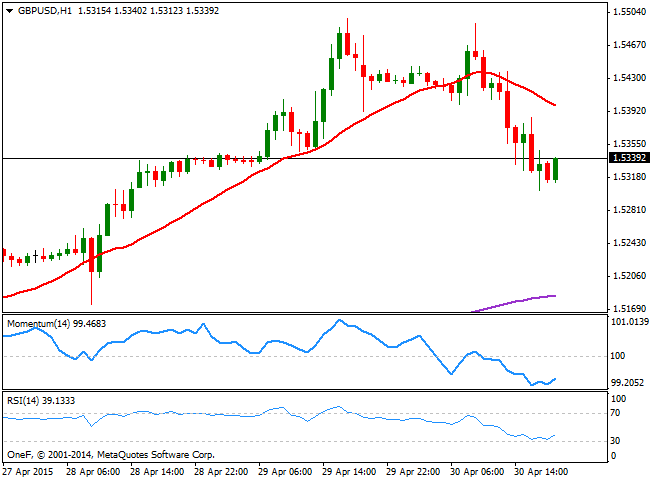
The British Pound fell sharply against the greenback, as the pair failed to advance beyond the 1.5500 region with dollar's initial decline, weighed by profit taking amid month-end and the upcoming UK elections. There were no relevant news in the UK, although Britain will release its money figures and the Marking Manufacturing PMI for April this Friday. Short term, the bearish potential prevails as the 1 hour chart shows that the price holds below a bearish 20 SMA, currently offering dynamic resistance around 1.5400, whilst the technical indicators are barely bouncing from oversold levels. In the 4 hours chart the price battles around a bullish 20 SMA, whilst the technical indicators head sharply lower and are now approaching their mid-lines. If the pair can't regain the 1.5400 level, the risk will remain to the downside, with a break below the mentioned daily low, triggering a bearish run towards 1.5260, a strong static support.
Support levels: 1.5300 1.5260 1.5220
Resistance levels: 1.5390 1.5445 1.5500
USD/JPY Current price: 119.35
View Live Chart for the USD/JPY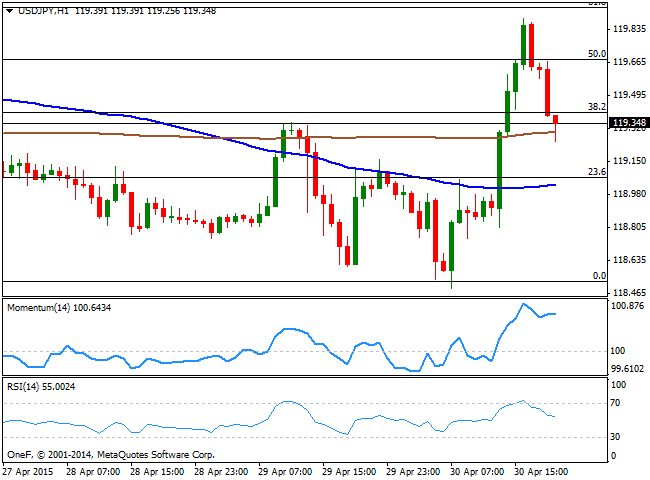
The USD/JPY tested both extremes of its latest range, falling down to 118.48 during the past Asian session and after the BOJ left its economic policy unchanged, and recovering up to 119.89 after the US economic releases. The pair also retreated from this last, and holds in positive territory by US close. Technically, the 1 hour chart shows that the price extended below the 38.2% retracement of its latest daily fall, but remains above its moving averages, with the 200 SMA acting as immediate support in the 119.30 region. In the same time frame, the Momentum indicator heads higher in overbought territory although the RSI indicator heads sharply lower around 57, increasing the potential of further declines. In the 4 hours chart the price failed to establish above its moving averages whilst the technical indicators are losing their upward strength but holding above their mid-lines, limiting chances of a stronger decline.
Support levels: 119.30 118.90 118.50
Resistance levels: 119.65 120.00 120.45
AUD/USD Current price: 0.7909
View Live Chart for the AUD/USD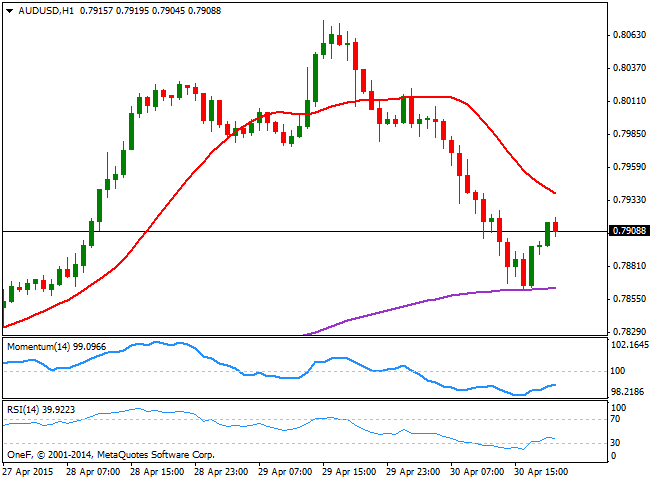
The Australian dollar fell down to 0.7862 against the greenback, erasing most of its latest gains. The pair broke the critical 0.8000 figure during the Asian session, following a dovish RBNZ that down-talked the NZD. The break below the figure triggered stops and with metals back in the red, it was all the way down for the AUD/USD pair during most of the day. Having recovered some ground during the US afternoon, the 1 hour chart shows that the price stands well below its 20 SMA, currently offering an immediate resistance in the 0.7940 region, whilst the technical indicators recovered from oversold levels but show no upward momentum, suggesting current recovery is just corrective. In the 4 hours chart, the price stands well below its 20 SMA that anyway maintains a bullish slope, whilst the Momentum indicator heads strongly lower below 100 and the RSI indicator also heads south around 48, all of which supports additional declines should the price remain below the 0.7940 level.
Support levels: 0.7900 0.7860 0.7825
Resistance levels: 0.7940 0.7980 0.8025
Recommended Content
Editors’ Picks

Gold hovers around all-time highs near $3,250
Gold is holding steady near the $3,250 mark, fuelled by robust safe-haven demand, trade war concerns, and a softer-than-expected US inflation gauge. The US Dollar keeps trading with heavy losses around three-year lows.

EUR/USD retreats towards 1.1300 as Wall Street shrugs off trade war headlines
The EUR/USD pair retreated further from its recent multi-month peak at 1.1473 and trades around the 1.1300 mark. Wall Street manages to advance ahead of the weekly close, despite escalating tensions between Washington and Beijing and mounting fears of a US recession. Profit-taking ahead of the close also weighs on the pair.

GBP/USD trims gains, recedes to the 1.3050 zone
GBP/USD now gives away part of the earlier advance to fresh highs near 1.3150. Meanwhile, the US Dollar remains offered amid escalating China-US trade tensions, recession fears in the US, and softer-than-expected US Producer Price data.

Bitcoin, Ethereum, Dogecoin and Cardano stabilze – Why crypto is in limbo
Bitcoin, Ethereum, Dogecoin and Cardano stabilize on Friday as crypto market capitalization steadies around $2.69 trillion. Crypto traders are recovering from the swing in token prices and the Monday bloodbath.

Is a recession looming?
Wall Street skyrockets after Trump announces tariff delay. But gains remain limited as Trade War with China continues. Recession odds have eased, but investors remain fearful. The worst may not be over, deeper market wounds still possible.

The Best brokers to trade EUR/USD
SPONSORED Discover the top brokers for trading EUR/USD in 2025. Our list features brokers with competitive spreads, fast execution, and powerful platforms. Whether you're a beginner or an expert, find the right partner to navigate the dynamic Forex market.