EUR/USD Current price: 1.2505
View Live Chart for the EUR/USD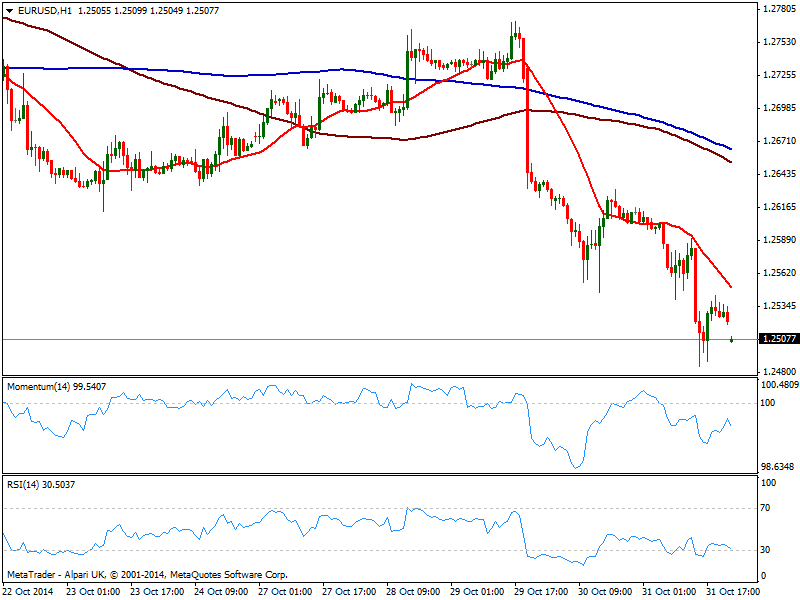
Dollar gaps higher across the board, still the king among currencies: last week, not only FED finished for good its QE plans, but BOJ unexpectedly increased the pace at which it expands base money to about ¥80 trillion a year, fueling dollar rally against mayor rivals: stocks soared across the world and US 10Y yields spike above 2.30% back from year lows. For the upcoming days, the ECB will made its announcement of its economic policy, while the US will release its employment monthly data, both set to confirm latest dollar strength: as for the ECB, the European Central Bank does not have much more to do to boost local growth expect lunch QE, which will only widen the imbalance with the US economy; as for US employment data, latest subcomponents in mayor readings along with weekly unemployment claims steady near multi year lows for the last 5 weeks, which suggest another month of strong jobs creation.
Technically, the EUR/USD trades near 1.2500, having posted a year low of 1.2485 last Friday and with the technical picture supporting further declines: the 1 hour chart shows price well below a bearish 20 SMA and indicators turning south deep in the red after barely correcting oversold readings. In the 4 hours hart indicators present a strong bearish momentum, heading still south despite in oversold territory: further declines towards strong midterm support at 1.2370 are now expected, with recoveries up to 1.2580 seen as selling opportunities.
Support levels: 1.2485 1.2440 1.2370
Resistance levels: 1.2530 1.2580 1.2620
EUR/JPY Current price: 141.29
View Live Chart for the EUR/JPY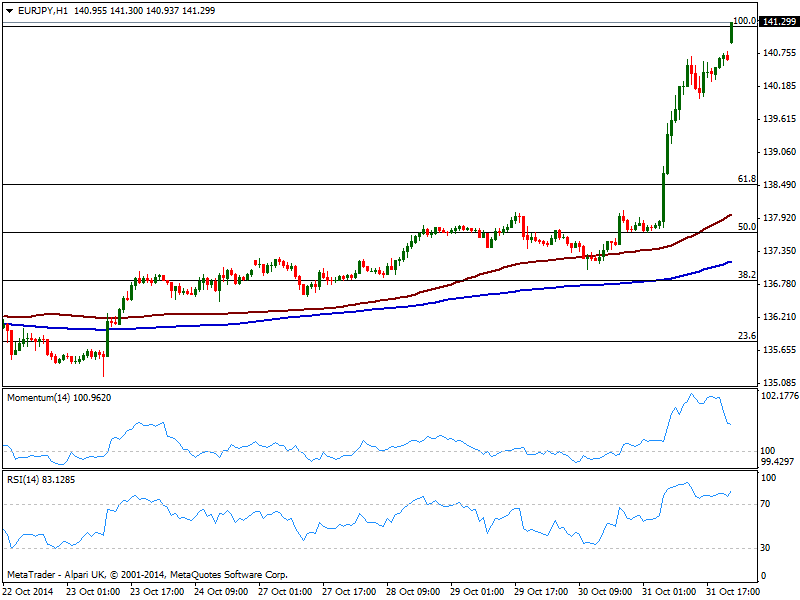
Yen crosses advanced average 300 pips on Friday, surging to multi-year highs along with Nikkei that trades at a 7 year high having spiked as much as 5% just in the last hour of trade last Friday, extending over hours its run up to 19666: the EUR/JPY soared to overcome by a handful pips 141.27, September high, now trading at levels last seen in May this year. Technically, the 1 hour chart shows RSI following price higher not at 83, with latest advance leaving price well above moving averages, now meaningless for intraday traders. Momentum in the mentioned time frame corrected extreme overbought readings and remains well above its midline, having already erased overbought readings. In the 4 hours chart indicators head strongly north despite in extreme overbought levels, supporting now further advances for the upcoming hours. Immediate resistance stands around 141.70, where the daily chart presents several highs and lows from early this year, while unlikely retracements down to 140.40 won’t hurt dominant bullish trend and likely attract buyers if reached.
Support levels: 140.90 140.40 139.80
Resistance levels: 141.70 142.30 142.85
GBP/USD Current price: 1.5978
View Live Chart for the GBP/USD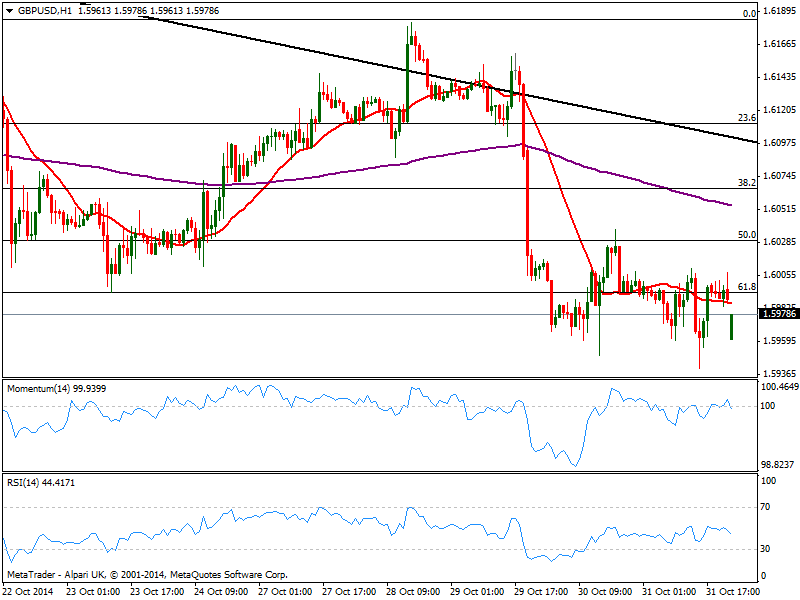
Pound seems not yet ready to give up against the greenback, as despite the pair established lower low daily basis for most of these last few days, the pair continues struggling to extend its decline below 1.6000 which has become quite a magnet area lately. Monday may see some consolidation around the level as to the usual quietness of market, this one we have key data by the end of the week. Nevertheless, the pair is biased lower, opening also down but quickly filling the gap. The 1 hour chart shows a mild bearish 20 SMA a few pips above current price, as indicators turn lower around their midlines, while in the 4 hours chart indicators are biased south below their midlines, while 20 SMA bearish slope converges with the 50% retracement of the latest bullish run, acting as ultimate intraday resistance in the 1.6035 price zone.
Support levels: 1.5950 1.5910 1.5875
Resistance levels: 1.6000 1.6035 1.6060
USD/JPY Current price: 112.95
View Live Chart for the USD/JPY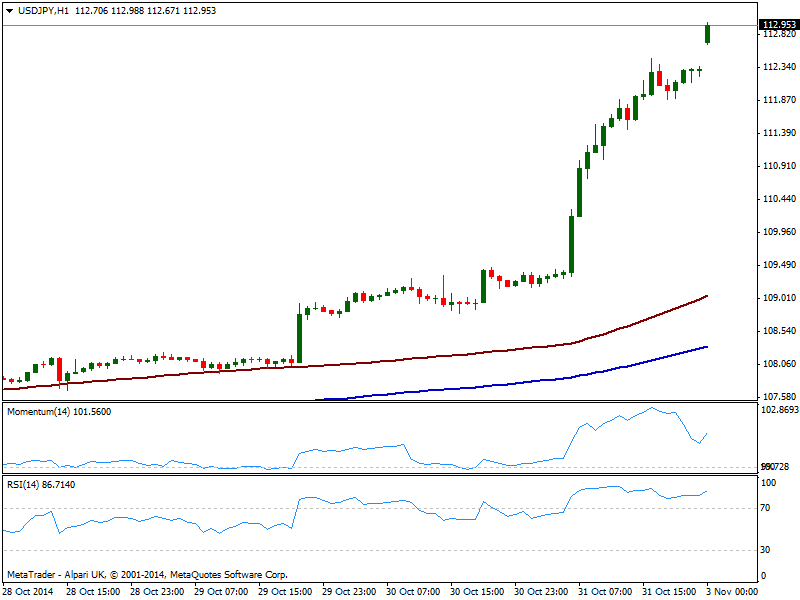
Not only the USD/JPY gaps higher, but it also trades at levels not seen since December 2007, flirting with 113.00. The rally sees no relief with the 1 hour chart showing indicators at extreme overbought territory yet still heading higher, with no signs of changing direction. The 4 hours chart shows a steady advance of almost 380 pips which left indicators also in extreme overbought territory, but still heading higher and far from suggesting any small pullback. Last Friday’s close around 112.30 is the immediate support as pullbacks towards the level are likely to be seen as buying opportunities; a break above 113.10 on the other hand, exposes the pair to further gains, eyeing then an approach to the 114.00 price zone.
Support levels: 112.30 111.85 111.50
Resistance levels: 113.10 113.50 113.90
AUD/USD Current price: 0.8754
View Live Chart of the AUD/USD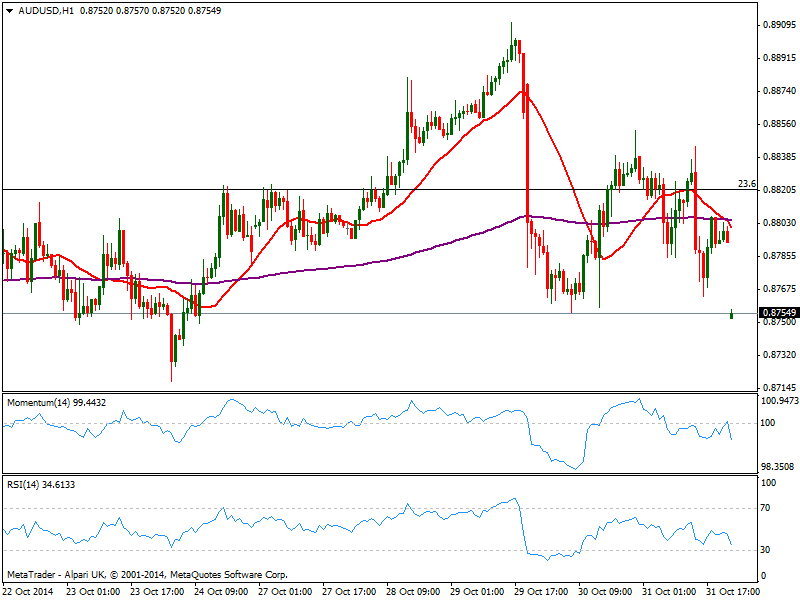
Australian dollar tumbled the most early weekly opening, on news China’s manufacturing slowed further last October: the government’s Purchasing Managers’ Index (CPMINDX) was at 50.8, down from September’s 51.1. Aussie is not only weighed by the softer than expected reading in its commercial partner, but also by the decline in gold’s price that trade at levels of 2010. Upcoming Tuesday, the RBA will be the first Central Bank to announce its economic policy this week, also expected to bring some volatility particularly to Asian currencies: as usual, the bank is not expected to move rates, and maintain a dovish stance to down talk the local currency. Short term, the 1 hour chart shows 20 SMA crossing below 200 EMA, as indicators turn strongly south below their midlines and price hovers at last week low. In the 4 hours chart indicators accelerated lower as 20 SMA slowly gains a shy bearish slope above current price, favoring a continued decline: break through 0.8730 is required to confirm the move that can extend down to 0.8640 price zone.
Support levels: 0.8730 0.8690 0.8640
Resistance levels: 0.8770 0.8820 0.8850
Recommended Content
Editors’ Picks

AUD/USD: Extra gains need to clear 0.6400
AUD/USD rose for the third day in a row, approaching the key 0.6400 resistance on the back of the acute pullback in the US Dollar amid mounting recession concerns and global trade war fear.

EUR/USD: Powell and the NFP will put the rally to the test
EUR/USD gathered extra steam and advanced to multi-month peaks near 1.1150, although the move fizzled out somewhat as the NA session drew to a close on Thursday.

Gold looks offered near $3,100
Prices of Gold remain on the defensive on Thursday, hovering around the $3,100 region per troy ounce and retreating from earlier all-time peaks near the $3,170 level, all against the backdrop of investors' assessment of "Liberation Day".

Interoperability protocol hyperlane reveals airdrop details
The team behind interoperability protocol Hyperlane shared their upcoming token airdrop plans happening at the end of the month. The airdrop will occur on April 22, and users can check their eligibility to receive $HYPER tokens via a portal provided by the Hyperlane Foundation by April 13, the team shared in a press release with CoinDesk.

Trump’s “Liberation Day” tariffs on the way
United States (US) President Donald Trump’s self-styled “Liberation Day” has finally arrived. After four straight failures to kick off Donald Trump’s “day one” tariffs that were supposed to be implemented when President Trump assumed office 72 days ago, Trump’s team is slated to finally unveil a sweeping, lopsided package of “reciprocal” tariffs.

The Best brokers to trade EUR/USD
SPONSORED Discover the top brokers for trading EUR/USD in 2025. Our list features brokers with competitive spreads, fast execution, and powerful platforms. Whether you're a beginner or an expert, find the right partner to navigate the dynamic Forex market.