- Tesla shares suffer again on Wednesday, drop 4%.
- TSLA broke triangle support, support zone sub $500.
- TSLA shares have support at $579 and $539 on the way lower.
Update May 13: Tesla continues to trade in textbook fashion from a triangle break lower. Next up is the 200-day moving average at $579 and then the low from March 5 at $539. If these are broken, Tesla shares chould head below $500 to the consolidation zone from September and October of last year.
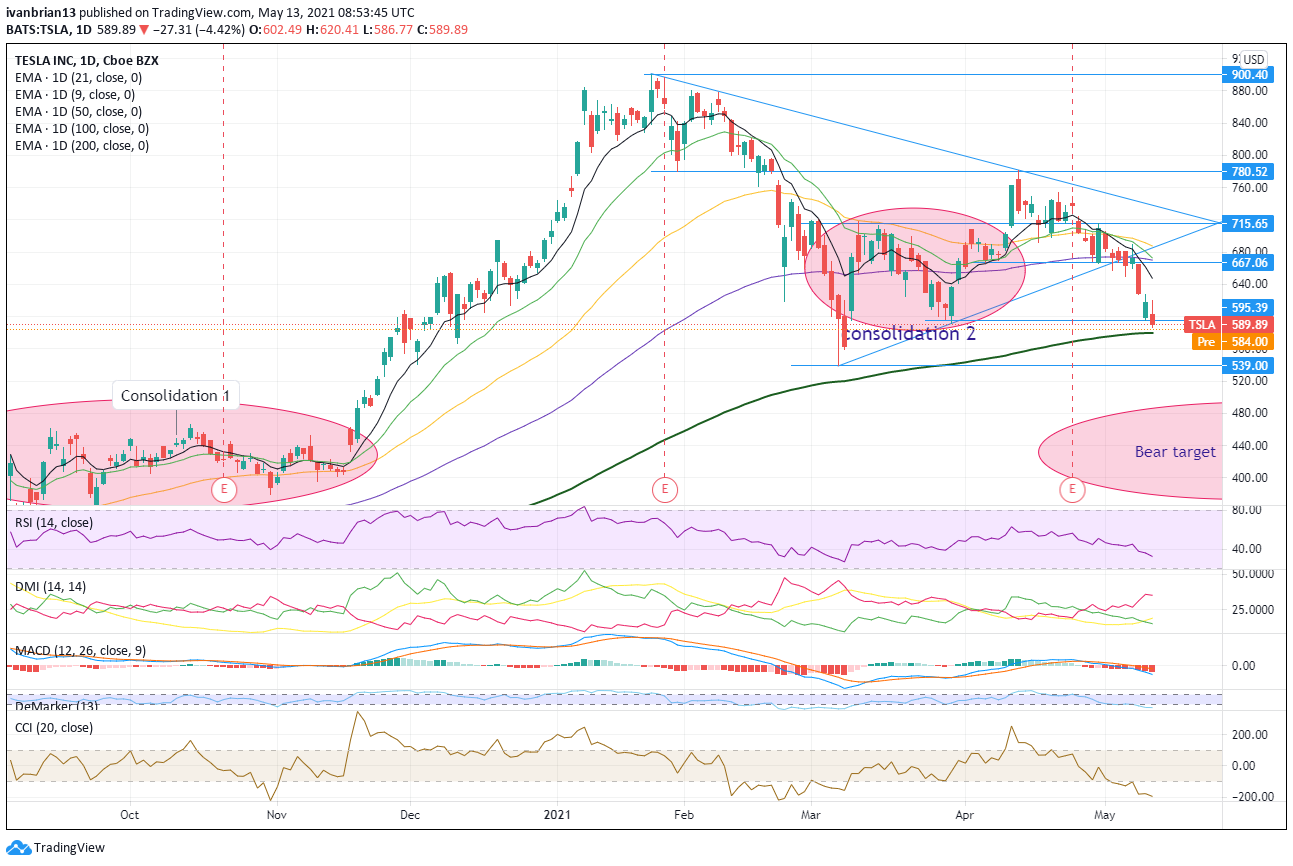
Update: Tesla shares continue to suffer on Tuesday as risk-off hurts equities as investors turn cautious ahead of Friday's employment report. Tesla is dangerously close to breaking the lower end of its triangle support. A break would be bearish with a sub $500 as next support.
Tesla shares have just not been right since reporting earnings on April 26. Earnings per share (EPS) did beat analyst expectations, but the manner of the beat and revenue did not sit well with investors. Basically, Tesla made a lot of money from Bitcoin trading and from environmental credits – not from selling vehicles.
Stay up to speed with hot stocks' news!
Tesla is one of the most well-known and followed stocks and garners significant attention from both retail and institutional investors. Elon Musk is rarely out of the news, and Tesla has revolutionized the adoption of electric vehicle technology. However, investors are now wondering if Tesla has poked the bear, so to speak, and may end up being a victim of its own success. All legacy carmakers have announced plans to commit to a fully electric future. The majority of legacy auto manufacturers have targeted 2030 for this transition.
Tesla stock forecast
Tesla is more volatile than the broader stock market, i.e. it has a higher beta. It has been suffering volatile falls given its rapid appreciation last year.
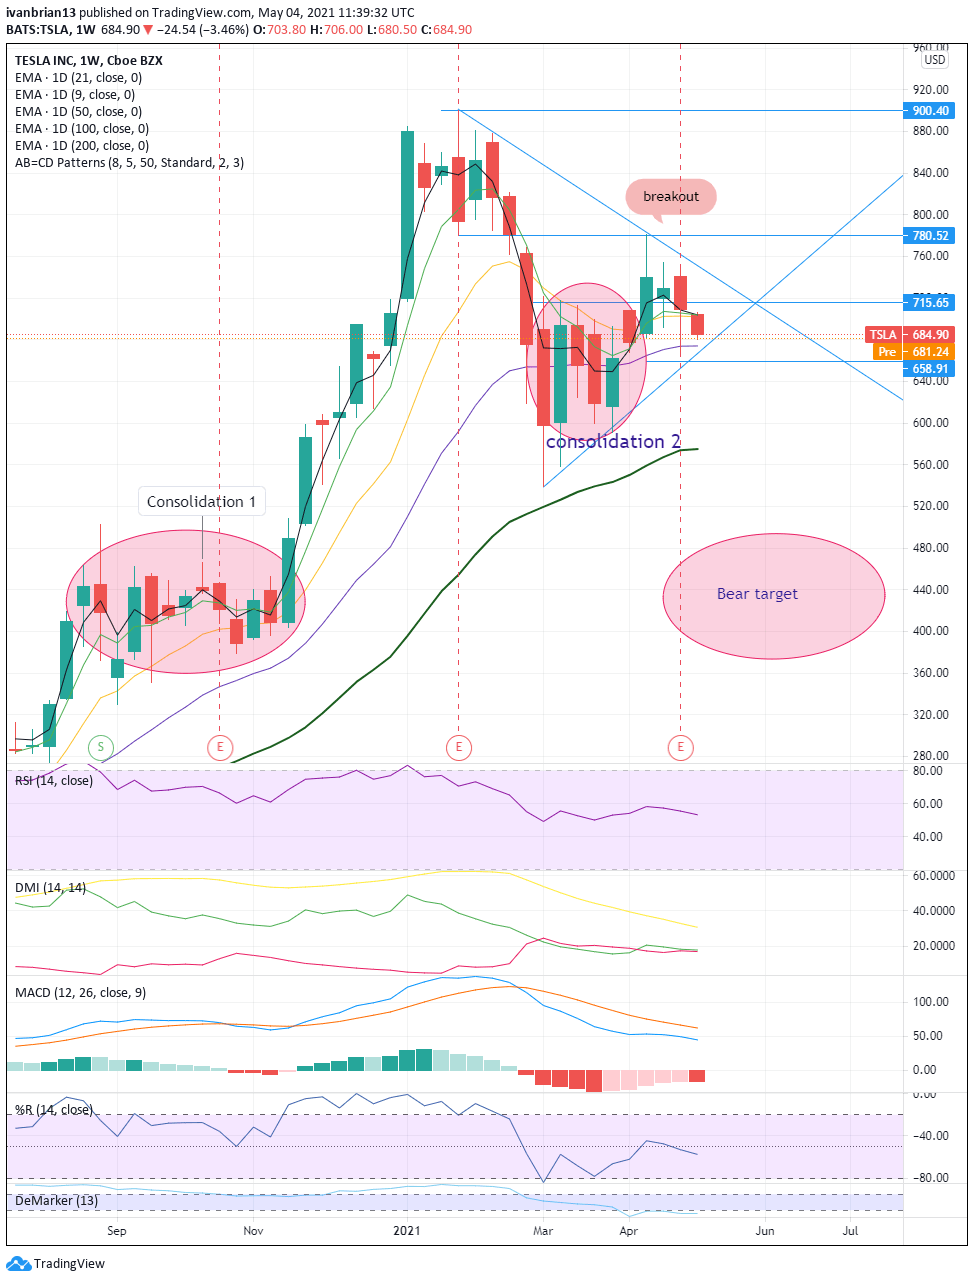
The longer-term chart clearly shows where Tesla has come from, as well as the strong first phase of price consolidation and the sudden and sharp pace of the breakout. This is what breakouts are supposed to look like, sharp and sudden. Now Tesla has returned to the price range of its second consolidation. The bear target could be a return to the original consolidation area below $500. $780 is a big resistance level, and failure to breach has resulted in a bearish move.
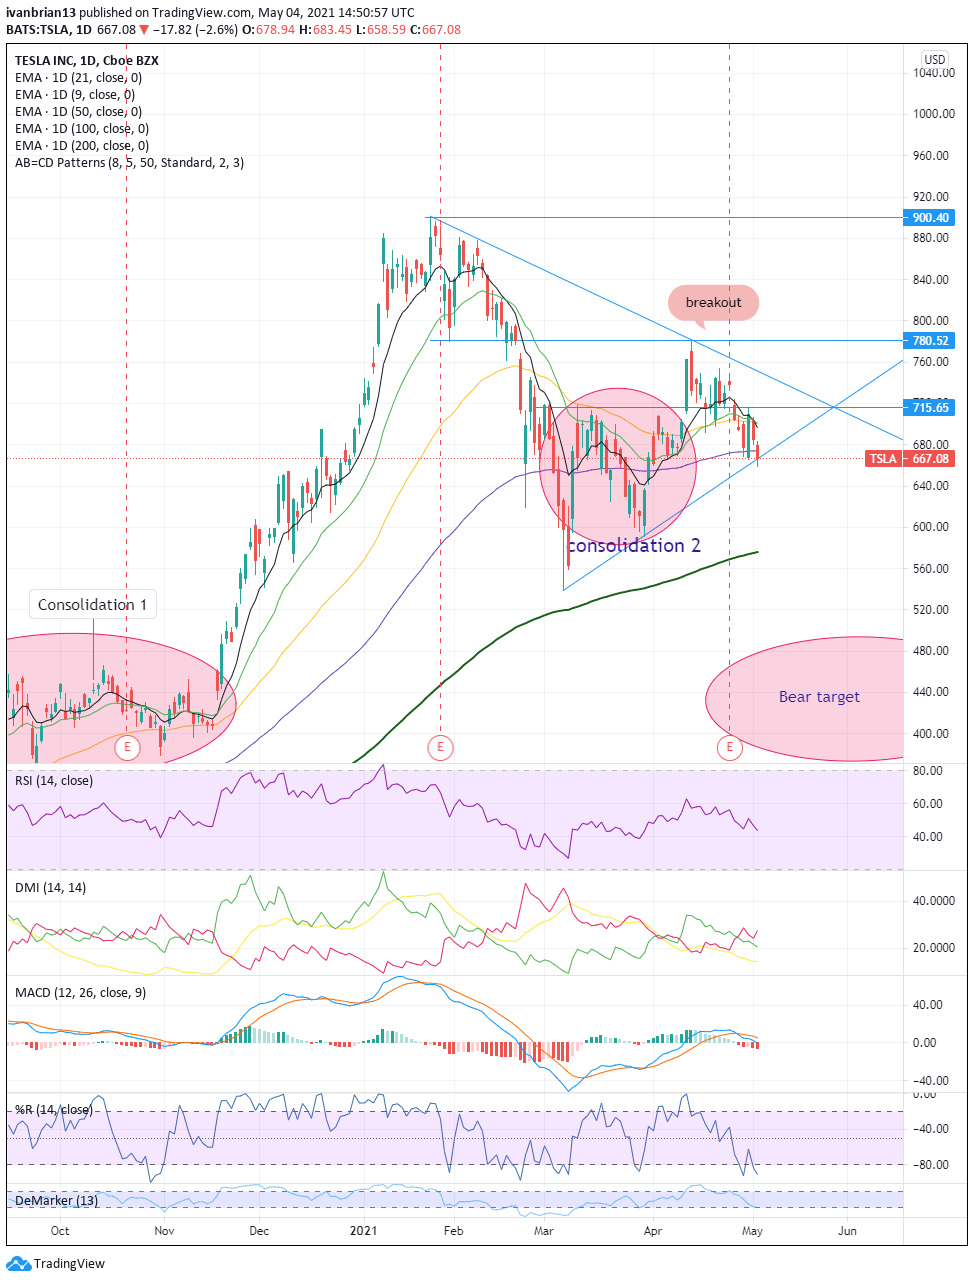
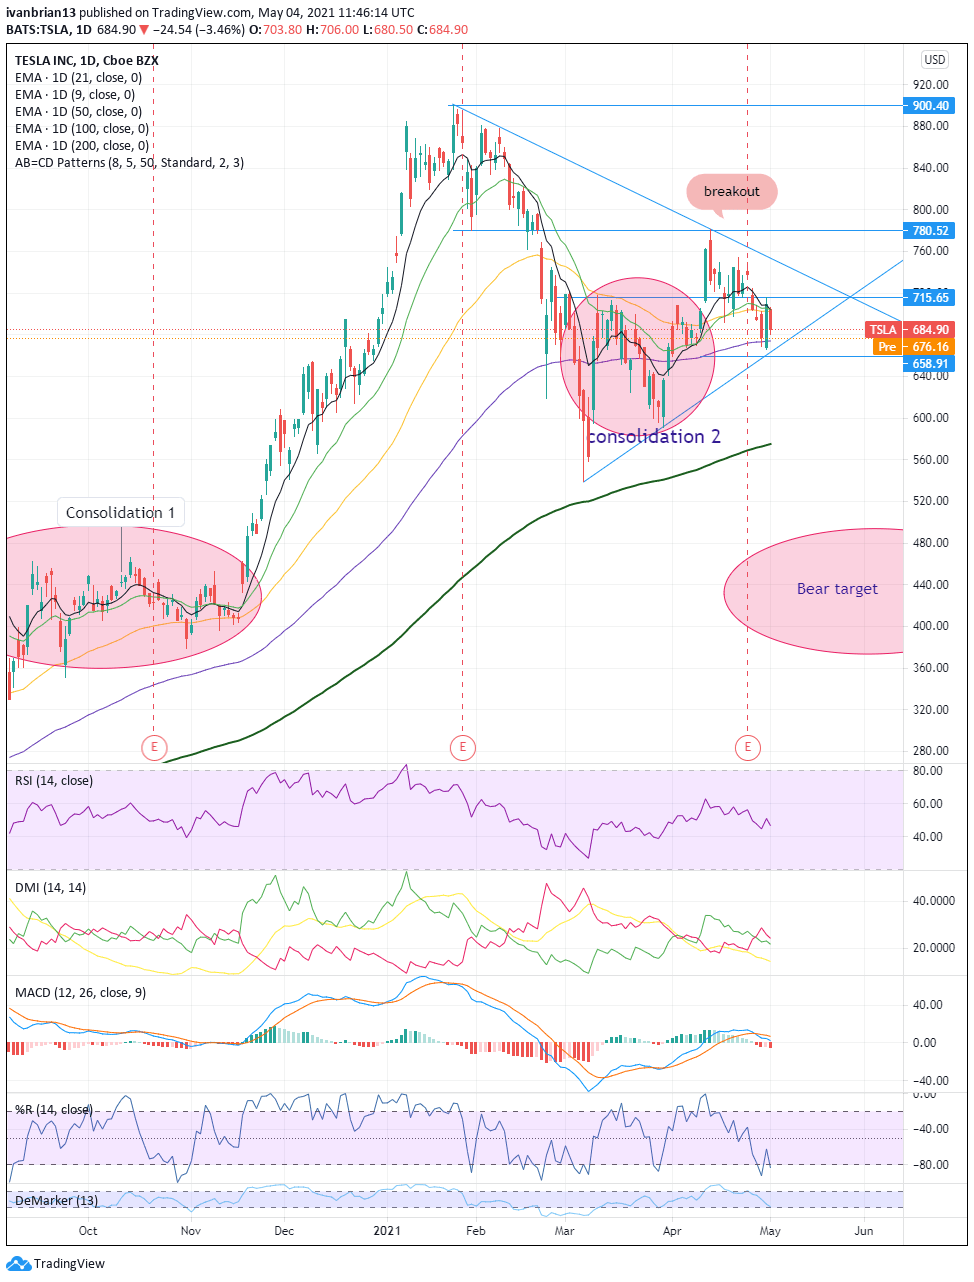
The daily chart shows us the problem for Tesla bulls. The 9-day moving average is holding Tesla in place, and this is now converging into a strong resistance area as the 9, 21 and 50-day moving averages converge around $702. This will prove tough to break. Should TSLA break above here, it will be a strong bullish move with a target of $750, the top of the triangle formation and an ultimate test of new highs.
Failure to push higher will see Tesla shares target the lower end of the triangle at $667 and a breakout of the triangle could give bears the ultimate aim of a return to the first consolidation area. Support along the way comes in at $674 from the 100-day moving average and $575 from the 200-day moving average.
Moving Average Convergence Divergence (MACD) has crossed into a negative signal as has the Directional Movement Index (DMI) but with a weak signal.
| Support | Resistance |
| 674 | 702 |
| 663 | 704 |
| 591 | 716 |
| 575 | 750 |
| 539 | 780 |
| 900 |
At the time of writing, the author has no position in any stock mentioned in this article and no business relationship with any company mentioned. The author has not received compensation for writing this article, other than from FXStreet.
This article is for information purposes only. The author and FXStreet are not registered investment advisors and nothing in this article is intended to be investment advice. It is important to perform your own research before making any investment and take independent advice from a registered investment advisor.
FXStreet and the author do not provide personalized recommendations. The author makes no representations as to accuracy, completeness, or the suitability of this information. FXStreet and the author will not be liable for any errors, omissions or any losses, injuries or damages arising from this information and its display or use. The author will not be held responsible for information that is found at the end of links posted on this page.
Errors and omissions excepted.
Information on these pages contains forward-looking statements that involve risks and uncertainties. Markets and instruments profiled on this page are for informational purposes only and should not in any way come across as a recommendation to buy or sell in these assets. You should do your own thorough research before making any investment decisions. FXStreet does not in any way guarantee that this information is free from mistakes, errors, or material misstatements. It also does not guarantee that this information is of a timely nature. Investing in Open Markets involves a great deal of risk, including the loss of all or a portion of your investment, as well as emotional distress. All risks, losses and costs associated with investing, including total loss of principal, are your responsibility. The views and opinions expressed in this article are those of the authors and do not necessarily reflect the official policy or position of FXStreet nor its advertisers. The author will not be held responsible for information that is found at the end of links posted on this page.
If not otherwise explicitly mentioned in the body of the article, at the time of writing, the author has no position in any stock mentioned in this article and no business relationship with any company mentioned. The author has not received compensation for writing this article, other than from FXStreet.
FXStreet and the author do not provide personalized recommendations. The author makes no representations as to the accuracy, completeness, or suitability of this information. FXStreet and the author will not be liable for any errors, omissions or any losses, injuries or damages arising from this information and its display or use. Errors and omissions excepted.
The author and FXStreet are not registered investment advisors and nothing in this article is intended to be investment advice.
Recommended content
Editors’ Picks
EUR/USD trades with negative bias, holds above 1.0700 as traders await US PCE Price Index

EUR/USD edges lower during the Asian session on Friday and moves away from a two-week high, around the 1.0740 area touched the previous day. Spot prices trade around the 1.0725-1.0720 region and remain at the mercy of the US Dollar price dynamics ahead of the crucial US data.
USD/JPY jumps above 156.00 on BoJ's steady policy

USD/JPY has come under intense buying pressure, surging past 156.00 after the Bank of Japan kept the key rate unchanged but tweaked its policy statement. The BoJ maintained its fiscal year 2024 and 2025 core inflation forecasts, disappointing the Japanese Yen buyers.
Gold price flatlines as traders look to US PCE Price Index for some meaningful impetus

Gold price lacks any firm intraday direction and is influenced by a combination of diverging forces. The weaker US GDP print and a rise in US inflation benefit the metal amid subdued USD demand. Hawkish Fed expectations cap the upside as traders await the release of the US PCE Price Index.
Sei Price Prediction: SEI is in the zone of interest after a 10% leap

Sei price has been in recovery mode for almost ten days now, following a fall of almost 65% beginning in mid-March. While the SEI bulls continue to show strength, the uptrend could prove premature as massive bearish sentiment hovers above the altcoin’s price.
US economy: Slower growth with stronger inflation

The US Dollar strengthened, and stocks fell after statistical data from the US. The focus was on the preliminary estimate of GDP for the first quarter. Annualised quarterly growth came in at just 1.6%, down from the 2.5% and 3.4% previously forecast.