Gold Price Forecast: XAU/USD lacks directional bias, awaits US Retail Sales for a range breakout
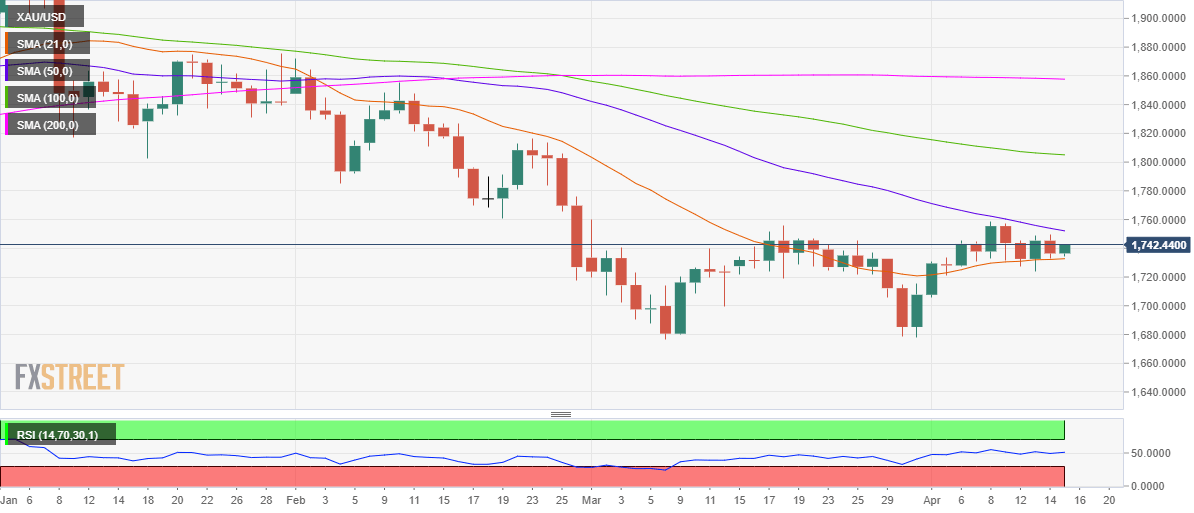
Gold (XAU/USD) returned to the red on Wednesday, although remained confined within the recent trading range, awaiting a strong catalyst for a clear direction. The yellow metal tumbled, as the US Treasury yields embarked upon a steady recovery amid infrastructure stimulus optimism, higher inflation expectations, successful covid vaccine rollouts in the country. However, the extended sell-off in the US dollar and mixed performance on Wall Street indices helped limit the declines in gold. The greenback remains undermined by the tempered expectations of the Fed’s tapering after the latest US CPI report failed to re-ignite fears over rising inflation. Read more...
Gold analysis: Once again tests 1,750.00
The yellow metal found support in the 1,735.00 level and surged. At mid-day on Thursday, the commodity price was testing the resistance zone, which was located just below the 1,750.00 marks.
Note that this is the second attempt being made during this week's trading. In general, the future forecasts still remain upon whether or not the resistance zone holds. In the case of the metal passing the resistance of the 1,750.00 level, the pair could test the March high levels above the 1,755.00 marks. Read more...
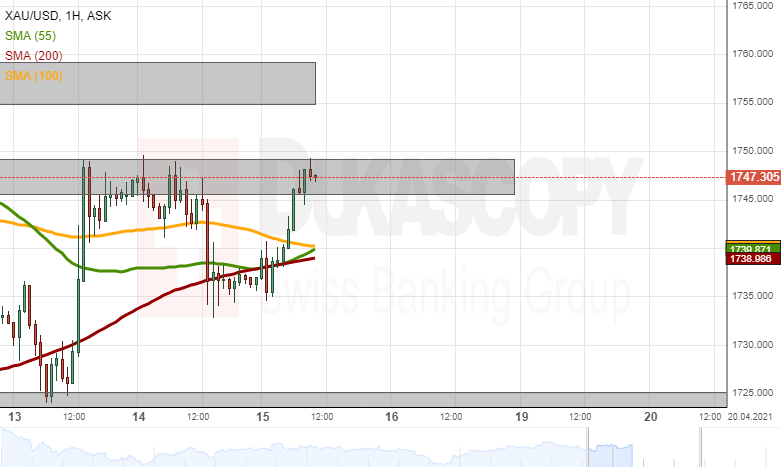
Gold Price Analysis: XAU/USD closes in on key $1,750 resistance
The XAU/USD pair closed in the negative territory on Wednesday but didn't have a difficult time reversing its direction on Thursday as US Treasury bond yields continue to drive gold's movements ahead. The benchmark 10-year US T-bond yield, which rose 1.4% on Wednesday, is currently losing 1.6% at 1.613%, helping XAU/USD preserve its bullish momentum.
On the four-hour chart, the Relative Strength Index (RSI) indicator edged higher to 60, suggesting that buyers are trying to remain in control of the price. However, gold lost its traction near $1,750 in the last two trading days and it could have a difficult time gathering bullish momentum unless it manages to make a daily close above that level. The next resistance could be seen at $1,758 (Apr. 8 high). Read more...
Information on these pages contains forward-looking statements that involve risks and uncertainties. Markets and instruments profiled on this page are for informational purposes only and should not in any way come across as a recommendation to buy or sell in these assets. You should do your own thorough research before making any investment decisions. FXStreet does not in any way guarantee that this information is free from mistakes, errors, or material misstatements. It also does not guarantee that this information is of a timely nature. Investing in Open Markets involves a great deal of risk, including the loss of all or a portion of your investment, as well as emotional distress. All risks, losses and costs associated with investing, including total loss of principal, are your responsibility. The views and opinions expressed in this article are those of the authors and do not necessarily reflect the official policy or position of FXStreet nor its advertisers. The author will not be held responsible for information that is found at the end of links posted on this page.
If not otherwise explicitly mentioned in the body of the article, at the time of writing, the author has no position in any stock mentioned in this article and no business relationship with any company mentioned. The author has not received compensation for writing this article, other than from FXStreet.
FXStreet and the author do not provide personalized recommendations. The author makes no representations as to the accuracy, completeness, or suitability of this information. FXStreet and the author will not be liable for any errors, omissions or any losses, injuries or damages arising from this information and its display or use. Errors and omissions excepted.
The author and FXStreet are not registered investment advisors and nothing in this article is intended to be investment advice.
Recommended content
Editors’ Picks
EUR/USD trades with negative bias, holds above 1.0700 as traders await US PCE Price Index

EUR/USD edges lower during the Asian session on Friday and moves away from a two-week high, around the 1.0740 area touched the previous day. Spot prices trade around the 1.0725-1.0720 region and remain at the mercy of the US Dollar price dynamics ahead of the crucial US data.
USD/JPY jumps above 156.00 on BoJ's steady policy

USD/JPY has come under intense buying pressure, surging past 156.00 after the Bank of Japan kept the key rate unchanged but tweaked its policy statement. The BoJ maintained its fiscal year 2024 and 2025 core inflation forecasts, disappointing the Japanese Yen buyers.
Gold price flatlines as traders look to US PCE Price Index for some meaningful impetus

Gold price lacks any firm intraday direction and is influenced by a combination of diverging forces. The weaker US GDP print and a rise in US inflation benefit the metal amid subdued USD demand. Hawkish Fed expectations cap the upside as traders await the release of the US PCE Price Index.
Sei Price Prediction: SEI is in the zone of interest after a 10% leap

Sei price has been in recovery mode for almost ten days now, following a fall of almost 65% beginning in mid-March. While the SEI bulls continue to show strength, the uptrend could prove premature as massive bearish sentiment hovers above the altcoin’s price.
US core PCE inflation set to signal firm price pressures as markets delay Federal Reserve rate cut bets

The core PCE Price Index, which excludes volatile food and energy prices, is seen as the more influential measure of inflation in terms of Fed positioning. The index is forecast to rise 0.3% on a monthly basis in March, matching February’s increase.