Mike Paulenoff, On Testing the All-Time High on S&P 500? (MPTrader.com)
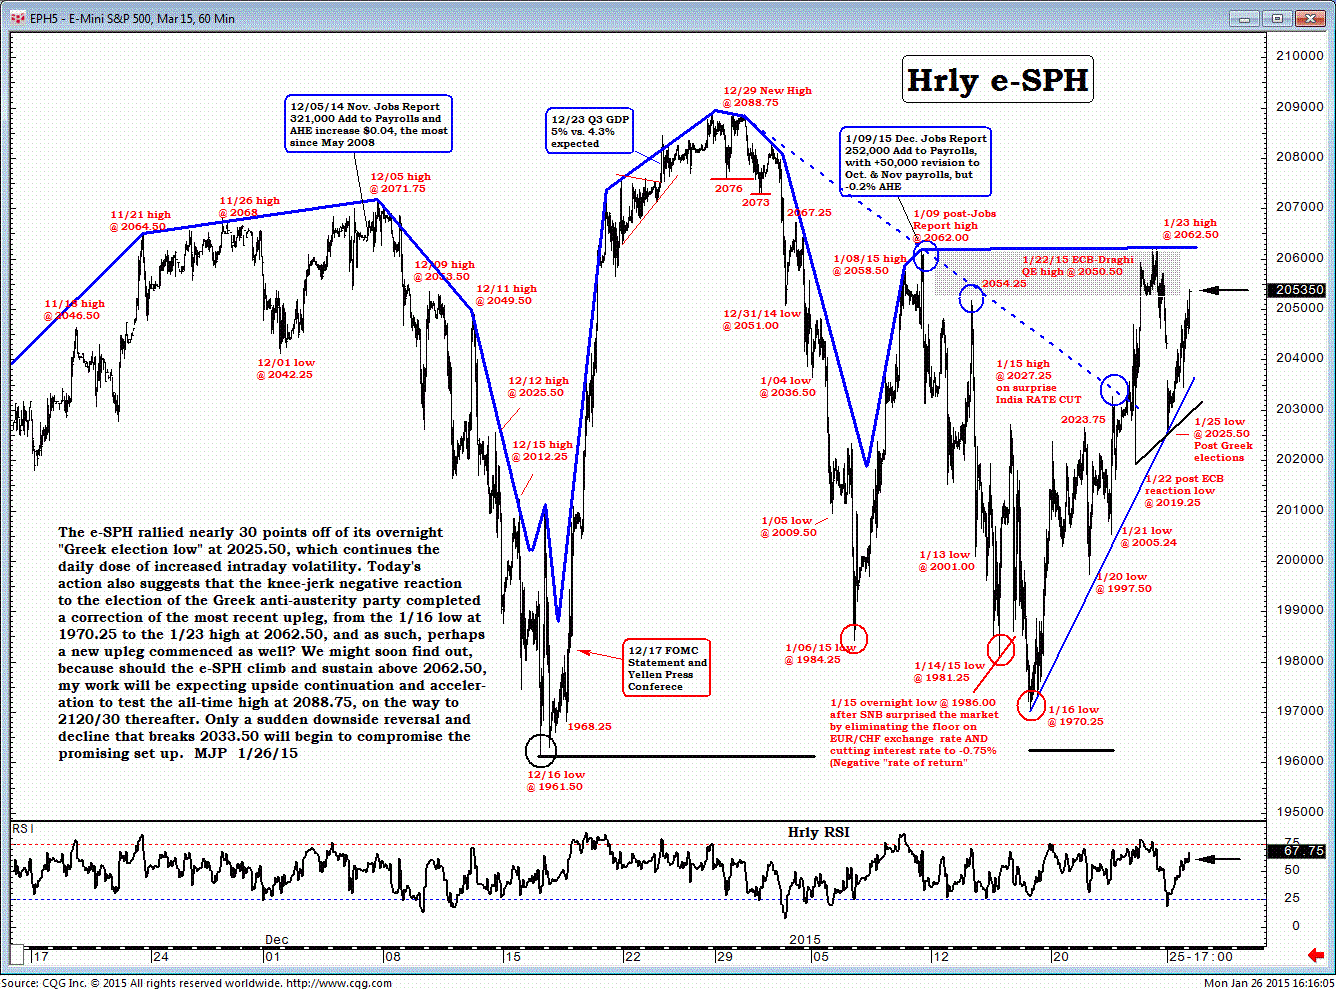
The Emini S&P 500 (e-SPH) rallied nearly 30 points off its overnight "Greek election low" at 2025.50, which continues the daily dose of increased intraday volatility.
Monday's action also suggests that the knee-jerk negative reaction to the election of the Greek anti-austerity party completed a correction of the most recent up-leg, from the Jan 16 low at 1970.25 to the Jan 23 high at 2062.50.
As such, perhaps a new up-leg commenced as well.
We might soon find out, because should the e-SPH climb and sustain above 2062.50, my work will be expecting upside continuation and acceleration to test the all-time high at 2088.75, on the way to 2120/30 thereafter.
Only a sudden downside reverals and decline that breaks 2033.50 will begin to compromise the promising set-up.
Jack Steiman, On Market "Handling Out" (SwingTradeOnline.com)
The market doesn't seem to know what it wants to do short term, but what I can tell you is that there is no selling nor buying of any great intensity as we're simply handling out. When the big picture trend is in a handle you still have to give the benefit of the doubt to the bulls. That said, you can't argue with the red flags either from the perspective of just ignoring them because you want to.
The technical set ups on all the key weekly and monthly index charts couldn't possibly be more bearish. Extremely elevated oscillators point and cross in a bearish fashion down. Not to mention the froth. In the end, even if the market blasts higher, isn't safety part of the game? I would like to think it is. So, as we try to sell from time to time and fail to follow through, it feels as if the market will never fall. And it may not. We could just break out from here, but understand there are correction-type headaches on the technical set-ups everywhere on those key, longer-term index charts.
The reason for the breakdowns not working is the actions from ECB last week. That, in concert with our Fed regarding rates here at home, is keeping the market from allowing the technical set-ups from playing out. They try to play out with a real selling episode but they just don't. So the battle is on. Technically-poor index charts versus Fed-interactions across the globe.
Nothing is easy, yet the emotion says to buy every dip and that's totally understandable. There's risk being long and there's risk being short. Greece's elections are now out of the way. The ECB QE program is now out of the way, so we turn to earnings and this week will be wild.
Avi Gilburt, On Running of the "Bull" in Silver & Gold (ElliottWaveTrader.net)
I am hard pressed to find a single article calling for lower lows in the metals. Everywhere I look, there is consistent certainty that the final lows have been struck, and the bull market is back in full force. To me, market sentiment can be summed up with a Yogi-ism - "it's déjà vu, all over again."
Unfortunately for those that have believed such bullish calls for the last 3 years, this is likely not the first time you have bought into this perspective. Each and every time has resulted in significant pain for metals bulls. And, so far, I have nothing that is proving to me this time is going to be any different.
Each and every time we have seen similar rallies in the last several years, I have felt so alone while standing within the bearish breach. Even though I have quite an accurate history over the last 3 years - starting with my top call in 2011 - many have thought me to be quite foolish to expect lower lows each and every time we have seen such a strong rally off the lows.
Each and every time, many have been so certain that the correction has run its course. And, each and every time, I have been proven right for maintaining my stance for lower lows yet to come. I don't think this time will be any different. Of course, I can always be wrong. But, I simply do not have enough of a completed pattern to the downside to confidently state that the long term correction has completed. Rather, I need at least one more lower low to confidently state the lows are in. Otherwise, I need a 5 wave structure off the November lows, followed by a corrective pullback to confidently state that the long term lows are in place. At this time, we have neither.
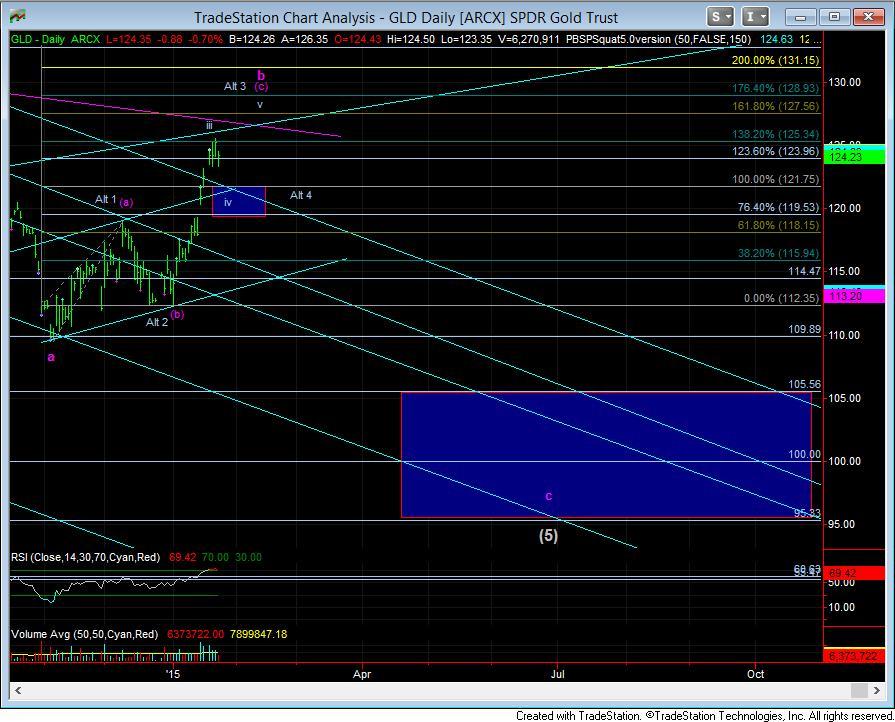
Yet, I still have to maintain an open mind that a bottom may be in. To that end, I am tracking the GLD for a pattern which can suggest that a bottom has been struck, despite the corrective start off the lows. In the bullish case, the GLD has completed a wave iii of 3 off the lows, or, in the bearish case, a wave iii of (c) of a b-wave off the lows. (As you can see, I have moved to Garrett Patten's (lead analyst for our World Market's service and contributing analyst to our Stockwaves service at Elliottwavetrader.net) GDX and HUI count, which has this entire c-wave decline in waves of 3.) And, as long as it maintains over the 119.50-121.75![]() 119.50-121.75
119.50-121.75![]() 119.50-121.75
119.50-121.75![]() 119.50-121.75 support zone for wave iv of 3/(c), there should still be another rally to be seen before we can differentiate between a 5 wave rally off the lows or a 3 wave corrective one. A break down below 119.50 from this point forth suggests that the (c) wave has topped.
119.50-121.75 support zone for wave iv of 3/(c), there should still be another rally to be seen before we can differentiate between a 5 wave rally off the lows or a 3 wave corrective one. A break down below 119.50 from this point forth suggests that the (c) wave has topped.
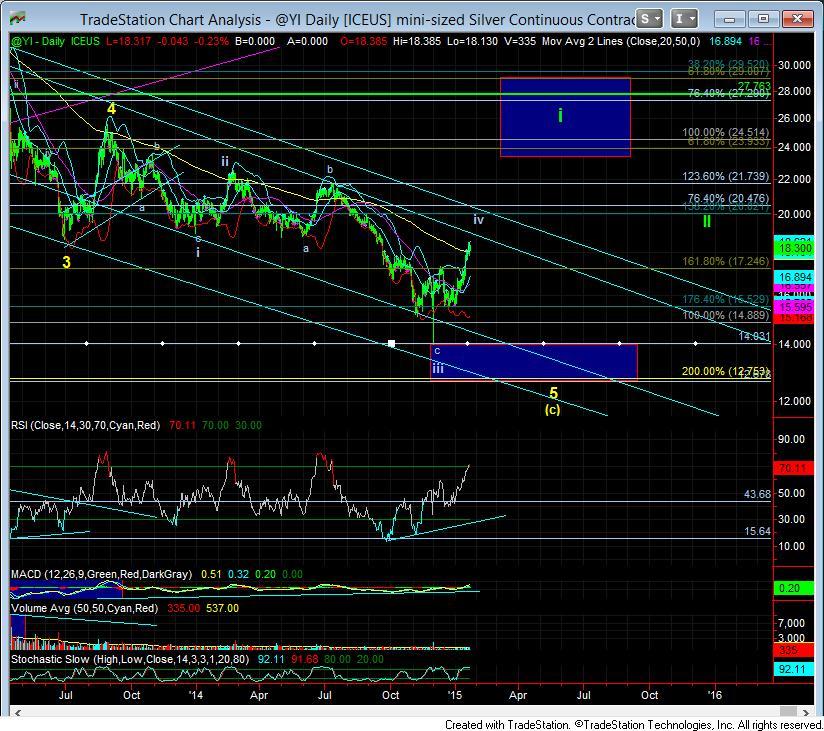
In silver, I also modified the count slightly into an ending diagonal for the 5th wave. This places us in the 4th wave of that ending diagonal. For the bullish case to take hold, the minimum target I would need to see to convince me of a bottom in silver would have to exceed the 22 region in 5 waves off the recent bottom, as that is the region of a 2.00 extension off the lows. However, it is quite rare for silver to only see a 5 wave structure taking it to the 2.00 extension. So, ideally, silver should exceed the 23 region, and strike the blue box for wave i in the bullish green count. Remember, the bullish count is not my preferred count at this point in time, but I will not ignore it should the market prove itself in 5 waves up to the target box. And, as I noted last weekend, an impulsive break down below 16.70 would get me much more immediately bearish.
Harry Boxer, On 4 Charts to Watch for Tuesday (TheTechTrader.com)
The stock market had quite a mixed day on Monday, and because of that we are going to jump right in and go over some of the ones that are still doing well.
Sucampo Pharmaceuticals, Inc. (SCMP), which we put a swing out on Monday, is doing well. I wanted to a swing on it the other day when it broke. Three days of consolidation had me convinced, especially on Monday when it popped out of a mini-wedge and was up 81 cents to 15.99, or 5.34%, on nearly 500,000 shares at 498,200. That was good volume for this stock. Targets are 18 and 21.
Unilife Corporation (UNIS) is acting very well. The highest close this stock has had was 4.69, in March 2014, almost a year ago, and again on Monday when it was up 64 cents, or 12.6%, to 4.69 on 1.4 million shares. Our target is a test of the 5.80 area. There's some resistance at 5.30, so that would be the short-term target.
Vuzix Corporation (VUZI) announced on Monday that will be listed on the NASDAQ Exchange on January 28. It popped 90 cents to 7.00, or 15%, on 541,500 shares traded. Short-term it could run. The target is 8-8.15. This is a very nice chart.
ZELTIQ Aesthetics, Inc. (ZLTQ) made a new all-time high on Monday, up 32.87 before closing at 32.68, up 2.60, or 8.6%, on 1 million shares. I don't think it's anywhere near done running. Near-term target is 36-7, and beyond that 45-6.
Other stocks on Harry's Charts of the Day are Agenus Inc. (AGEN), Anacor Pharmaceuticals, Inc. (ANAC), Array BioPharma, Inc. (ARRY), Celldex Therapeutics, Inc. (CLDX), Cree, Inc., DepoMed Inc. (DEPO), Himax Technologies, Inc. (HIMX) MannKind Corp. (MNKD), Neurocrine Biosciences Inc. (NBIX), NeuroDerm Ltd. (NDRM), NewLink Genetics Corporation (NLNK), InVivo Therapeutics Holdings Corp. (NVIV), Opko Health, Inc. (OPK), Planar Systems Inc. (PLNR), Radius Health, Inc. (RDUS), Regulus Therapeutics Inc. (RGLS), Sorrento Therapeutics, Inc. (SRNE), and SunEdison, Inc. (SUNE).
CallSend SMSAdd to SkypeYou'll need Skype CreditFree via SkypeThis Web site is published by AdviceTrade, Inc. AdviceTrade is a publisher and not registered as a securities broker-dealer or investment advisor either with the U.S. Securities and Exchange Commission or with any state securities authority. The information on this site has been obtained from sources considered reliable but we neither guarantee nor represent the completeness or accuracy of the information. In addition, this information and the opinions expressed are subject to change without notice. Neither AdviceTrade nor its principals own shares of, or have received compensation by, any company covered or any fund that appears on this site. The information on this site should not be relied upon for purposes of transacting securities or other investments, nor should it be construed as an offer or solicitation of an offer to sell or buy any security. AdviceTrade does not assess, verify or guarantee the suitability or profitability of any particular investment. You bear responsibility for your own investment research and decisions and should seek the advice of a qualified securities professional before making any investment.
Recommended Content
Editors’ Picks

AUD/USD: The hunt for the 0.7000 hurdle
AUD/USD quickly left behind Wednesday’s strong pullback and rose markedly past the 0.6900 barrier on Thursday, boosted by news of fresh stimulus in China as well as renewed weakness in the US Dollar.

EUR/USD refocuses its attention to 1.1200 and above
Rising appetite for the risk-associated assets, the offered stance in the Greenback and Chinese stimulus all contributed to the resurgence of the upside momentum in EUR/USD, which managed to retest the 1.1190 zone on Thursday.

Gold holding at higher ground at around $2,670
Gold breaks to new high of $2,673 on Thursday. Falling interest rates globally, intensifying geopolitical conflicts and heightened Fed easing bets are the main factors.

Bitcoin displays bullish signals amid supportive macroeconomic developments and growing institutional demand
Bitcoin (BTC) trades slightly up, around $64,000 on Thursday, following a rejection from the upper consolidation level of $64,700 the previous day. BTC’s price has been consolidating between $62,000 and $64,700 for the past week.

RBA widely expected to keep key interest rate unchanged amid persisting price pressures
The Reserve Bank of Australia is likely to continue bucking the trend adopted by major central banks of the dovish policy pivot, opting to maintain the policy for the seventh consecutive meeting on Tuesday.

Five best Forex brokers in 2024
VERIFIED Choosing the best Forex broker in 2024 requires careful consideration of certain essential factors. With the wide array of options available, it is crucial to find a broker that aligns with your trading style, experience level, and financial goals.


